


The ACT Debugger has four panes, two of which have multiple tabs. In the upper left corner, the Sources pane displays a folder for each extension that is loaded. If you load or unload extensions, the debugger refreshes this pane.
To view the files for a loaded extension, you expand the extension's folder. When you select a script, it opens in an editor in the pane to the right, where you can set breakpoints.
If you edit or save an XML file or script, the debugger automatically reloads the extension, thereby providing an efficient method for interactive testing of your changes.
The following figure shows the supplied extension
DebuggerDemo loaded. If you want, you can use the Extension Manager to install and load this extension. You can
then follow along with the short video on the ACT Debugger to learn how to use some
of its features.
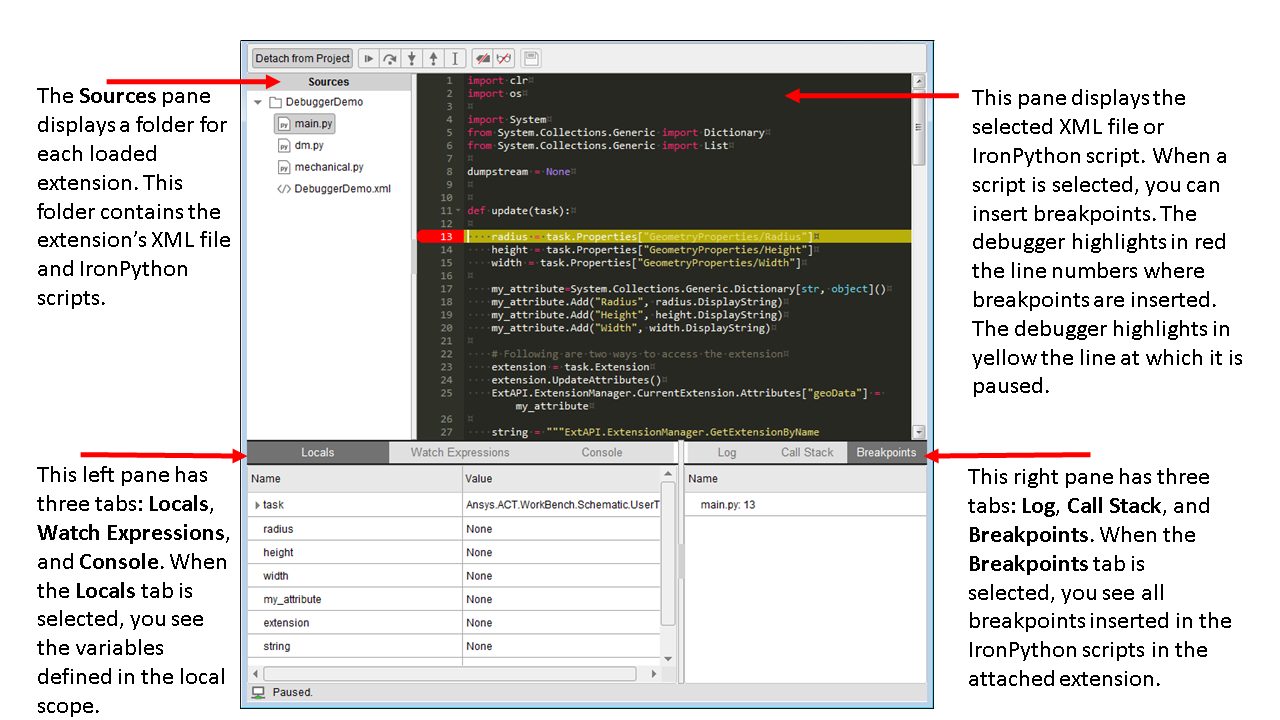
In this figure, the debugger is started from the Workbench
Project tab, and it is attached and listening to the
extension DebuggerDemo. A breakpoint is set at line 13 in the
script main.py, where the debugger is currently paused. Line
numbers for lines with breakpoints are highlighted in red. The line at which the
debugger is paused is highlighted in yellow.