


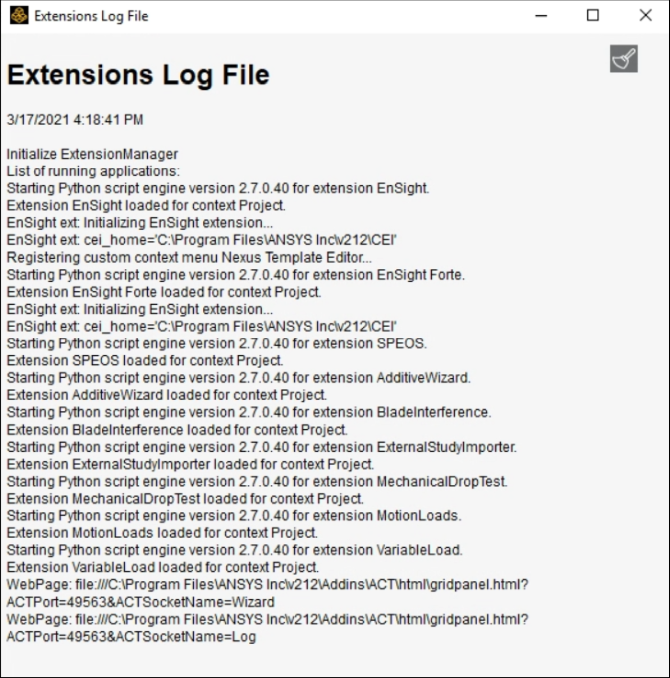
The Extensions Log File displays messages generated by extensions. If warnings are present, they display in orange. If errors are present, they display in red.
You can open the Extensions Log File from many different places:
- In Workbench:
You can open the Extensions Log File in one of two ways:
On the ACT Start Page, click the button in the toolbar.

Select > .
- In DesignModeler:
From the ACT Development toolbar, click the button for switching between opening and closing the Extensions Log File. This toolbar is available only when the Debug Mode check box is selected in > > .

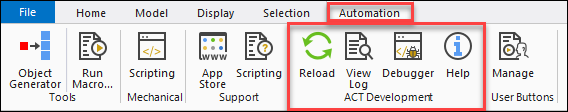
- In Mechanical:
In the ACT Development group on the ribbon's Automation tab, click View Log. This group is available only when the Debug Mode check box is selected in > > .
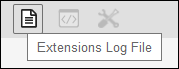
- In the App Builder:
In the toolbar for the ACT App Builder, click the button for the Extensions Log File.
You can resize and drag the window displaying the Extensions Log File. You can also keep this window open as you switch between products. To clear the Extensions Log File, you click the brush icon in the window's upper right corner.
Tip: To open the Extensions Log File in your web browser, you can copy all of the text that follows WebPage: and paste it into your browser's address bar. For example, given the log file shown in this topic, you'd copy and paste the following text:
file:///C:\Program Files\ANSYS Inc\v212\Addins\ACT\html\gridpanel.html?ACTPort=49563&ACTSocketName=Log