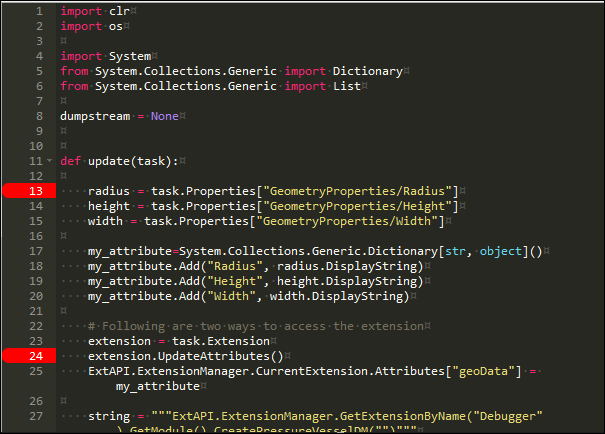
Breakpoints are essential to debugging. You set a breakpoint in each script location where you want to pause the debugger to investigate the current state of the extension. When the debugger encounters a breakpoint, it pauses extension execution, placing you in break mode. Most debugger features are available only in break mode.
Repeatedly clicking to the left of a line number switches between setting and clearing a breakpoint. To set or clear breakpoints, do not click the line number but to the left of it. You can set a breakpoint on any line with an executable statement. While it is possible to set a breakpoint on a commented line, blank line, or a declaration of a namespace, class, or method, such a breakpoint serves no purpose.
In the extension DebuggerDemo, assume that you have
inserted breakpoints at lines 13 and 24 in the script
main.py.

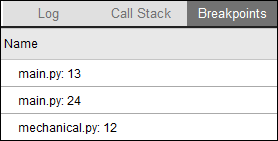
Also assume that you have set a breakpoint at line 12 in the script
mechanical.py. In the lower right pane of the debugger,
the Breakpoints tab displays all three breakpoints that are
currently set, displaying the filename first and the line number second:

You can double-click any entry in the Breakpoints tab to have the debugger move to this script and line. This tab is especially handy when you are debugging large or complex scripts.
After setting one or more initial breakpoints, you click the button in the debugger toolbar for attaching to the product so that the debugger begins listening to the execution of the extension. In the lower left corner of the debugger, the status bar displays operational information.

At a breakpoint, you can use buttons in the debugger toolbar to progress through script statements to investigate the state of the extension. In break mode, you can also set new breakpoints and clear existing ones. After you finish debugging, you can click the debugger toolbar button for clearing all breakpoints from the loaded scripts.


