


Sampling Points can be used in postprocessing mode to access to ply-wise results. In addition, the Sampling Point functionality provides Lay-Up Plots, through-the-thickness postprocessing plots, and laminate engineering constants.
ACP samples through the element near the given coordinates. After the update all plies (Modeling Ply, Production Ply, and Analysis Ply) are listed and can be selected for postprocessing. In the General tab of the Sampling Point Properties dialog the sampling point and direction can be defined.
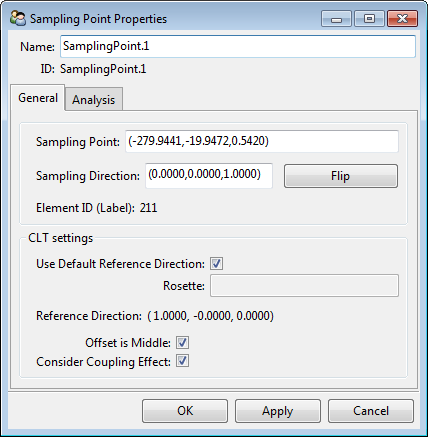
Sampling Point: The sampling point in global coordinates. The nearest element to the point is the sample.
Sampling Direction: Normal direction of the sampling point. The ply sequence will be given in this direction.
Element ID (Label): Element number closest to the defined sampling point. (informational only)
A detailed description of the options Offset is Middle and Consider Coupling Effect can be found in Analysis Options.Use the [and] buttons to navigate easily through the ply definition.
The Analysis tab of the Sampling Point Properties dialog provides extended postprocessing functionality. The lay-up can be visualized and analyzed by evaluating the polar properties and equivalent laminate stiffnesses based on the classical laminate theory. The 2D plots show the distributions of the postprocessing results (strains, stresses, and failure criteria). To view postprocessing results, you must select the solution and the set of interest.
The lay-up visualization can be set to display Modeling, Production, and Analysis Plies present in the Sampling Point. The Material, Thickness, and Angle can be displayed additionally as text labels for every ply in the plot. The angle displayed for Modeling and Production Plies always matches the design angle in the Modeling Ply and Material definitions. Note that the angle for the Analysis Ply is always given in relation to the reference direction of the Sampling Point. This reference direction is indicated by a yellow arrow at the Sampling Point in the Scene. You can change the reference direction in the General tab if desired.

Note: Stresses and strains shown in the 2D plot are the values at the element center (interpolated) at the top and bottom of the layer. The 2D failure plot shows the worst IRF, RF, or MoS factor of all failure criteria from among all the failure modes evaluated and among all evaluation points (nodal results).
The Python script below shows how to extract the nodal result in ACP for a certain element and Analysis Ply. When adapting it for your own project, modify the name of the objects such as Solution and Ply.
Python script to extract nodal stresses
model = db.active_model
# Select a solution and ensure that it was loaded
solution = model.solutions['Solution.1']
solution.update()

# Select the ANALYSIS PLY of interest
ap = model.modeling_groups["Hull"].plies['core_bwl'].production_plies['ProductionPly.9'].analysis_plies['P1L1__core_bwl']

# Select the critical element (also see Element ID in the general tab of the dialog of Sampling Point)
element_label = 3507
model.select_elements(selection='sel0', op='new', labels=[3507])

# Initialize the result data
results = {}
max_stress_values = {"s13": 0.0,
                     "s23": 0.0
                    }

# Loop over stress component and spots and collect the data and store the maximum values.
for comp in ["s13", "s23"]:
    results[comp] = {}
    for spot in ["bot", "mid", "top"]:
        res = solution.query(definition='stresses',
                             position='integration_point',
                             component=comp,
                             selection='sel0',
                             entity=ap,
                             spot=spot)
        results[comp][spot] = res
        max_v = max([abs(v) for v in res])
        if max_v > max_stress_values[comp]:
            max_stress_values[comp] = max_v

print(max_stress_values)