ACP supports failure analysis for composites for shell and solid models. These analyses are based on the same theory, including for sandwich criteria where the entire laminate stack is evaluated for instances of wrinkling.
In the case where a solid model is generated in ACP-Pre and a solution is available for the solid model, failure analysis for a solid model can be performed in two ways.
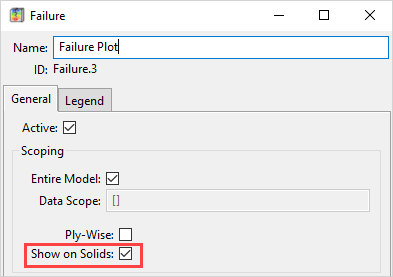
If the Show on Solids option is enabled, the solid mesh shows the worst failure value and mode per solid element. This plot can give you an overview about the general safety of the part, but may overlook some hot spots, since the worst failure can occur inside the laminate and be obscured. In layered structures, a critical failure may not occur in every layer, as opposed to isotropic parts where critical stresses are on the surface.
If the Show on Solids option is disabled, the worst failure per solid stack is projected onto the shell mesh. This makes internal failures visible, giving you a more detailed view of how the composite structure reacts under stress. The following figure shows the difference between the two graphical evaluation modes. The failure plot on the solid mesh (left) appears less critical when compared to the shell mesh (right), however, the overall maximum failure value is equal for both plots.
For an Imported Solid Model, enable both the Show on Solids option and the Entire Model scoping option to show the failure results on the solid mesh. This also means the failure plot cannot be projected onto a shell mesh, as is the case for a standard Solid Model.
In addition to the failure plot, strain, stress, and progressive damage plots can be created with the Show on Solids option.


