There are several features that can be used for viewing the results of a simulation. They all can give a different insight into the behavior of the composite structure. The different postprocessing visualizations mentioned below are also described in the last part of Tutorial 1.
Deformation
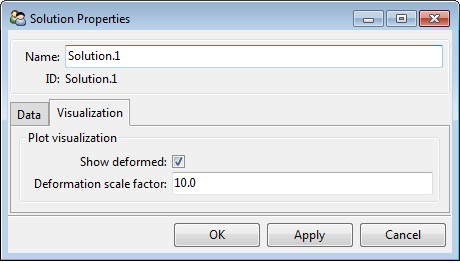
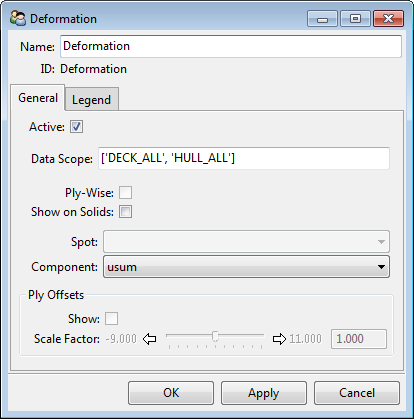
The deformation of a structure can be visualized with deformation plot for a specific solution (see Solution Plots). The plot can be scaled by setting the deformation scale factor in the Solution Properties dialog.
Failure Criteria
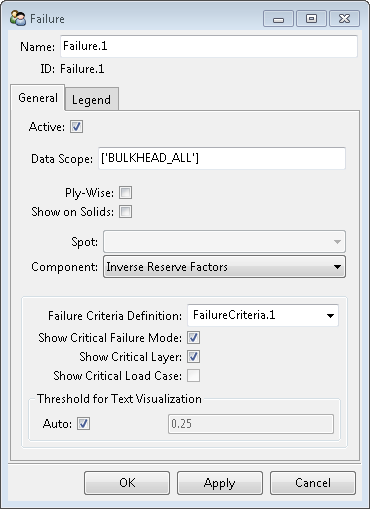
The failure plot displays the critical safety factors (reserve factors, inverse reserve factors & margin of safety) to first ply failure for a given failure criteria definition.
The safety factors are evaluated for every element and every layer and the critical value through the thickness of the lay-up is then projected on to the reference shell mesh. A failure plot for an envelope solution works in the same way and is a display of the most critical failure of all included solution sets. Alternatively, the safety factors can be displayed ply-wise for each analysis ply.
A failure criteria definition must be defined before creating a failure plot (see Definitions). A failure plot can be inserted under a normal solution or an envelope solution and the predefined failure criteria definition can be selected. Additionally, critical failure modes, critical plies and critical load case (in case of solution envelope) can be displayed as element labels.

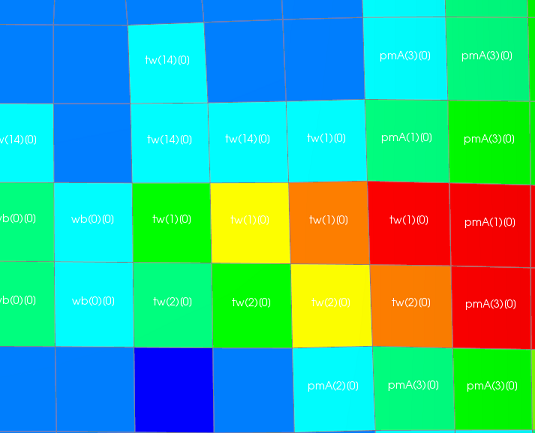
Ply-Wise Results
The structural behavior throughout the lay-up at each layer is of great interest in composite design. Ply-wise information helps to identify and optimize layers that are critical and ones that are not.
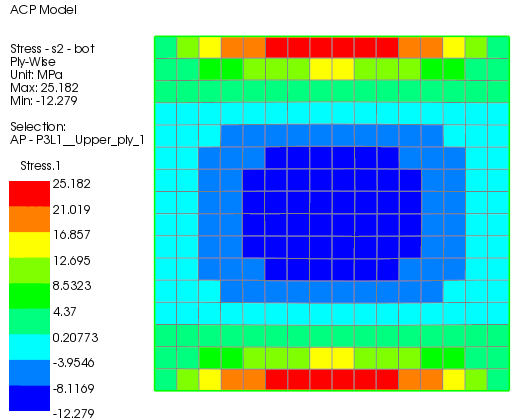
All the solution plots except the deformation plot have the option of displaying results ply-by-ply (see Solution Plots). The plot will only display results if a ply is selected. Plies can be selected in the Modeling Groups, Sampling Point, or Solid Model Analysis Plies.
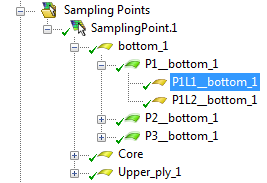
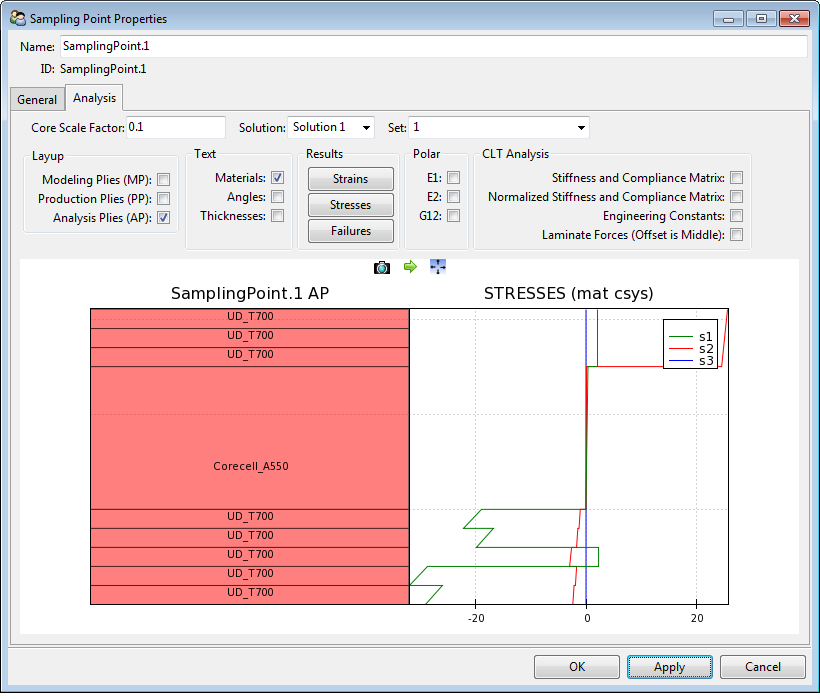
The Sampling Points are an alternative way of analyzing a lay-up on a ply level. A point of interest on the composite part is selected and its local lay-up is sampled. The feature can display failure criteria, stresses and strains through the thickness of the laminate. In this way, the Sampling Point gives a detailed insight into the laminate behavior ply-by-ply.