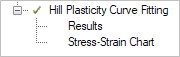
Once you have completed a Curve Fitting Analysis, you should review the computed material properties in the Results panel.
Note: The results of the fitting depend on the fiber volume fraction and the fiber aspect ratio that are specified either in the Geometry Options (for an RVE Model) or in the Setup Options (for an Analytical Model). See Parametrization of the Hill Yield Criterion in the theory chapter.
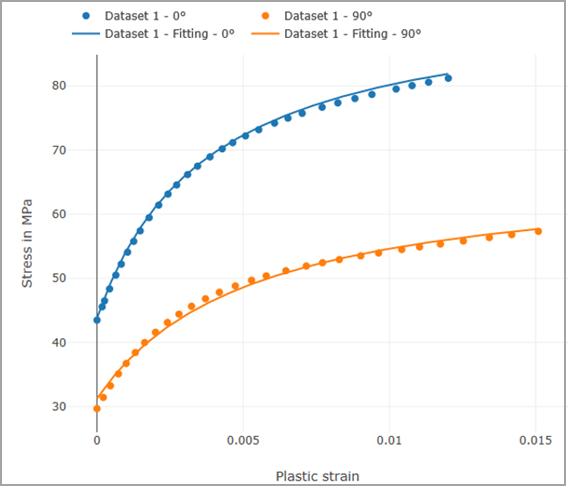
Click Stress-Strain Chart for a visual comparison between the experimental and the fitted stress-strain curves.
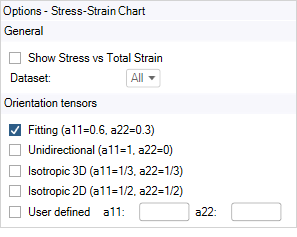
You can specify the following options:
Show Stress vs Total Strain: Display the stress vs total (rather than plastic) strain curve. When this option is active, the experimental curves are not shown. This option is available only when a Variable Analysis is defined and solved. (If the variable material depends on the Fiber Volume or Weight Fraction parameter, the elastic properties are evaluated at its default value.)
Dataset: By default, all Datasets are shown. Alternatively, you can display the results only for a selected Dataset (corresponding to a certain temperature value).
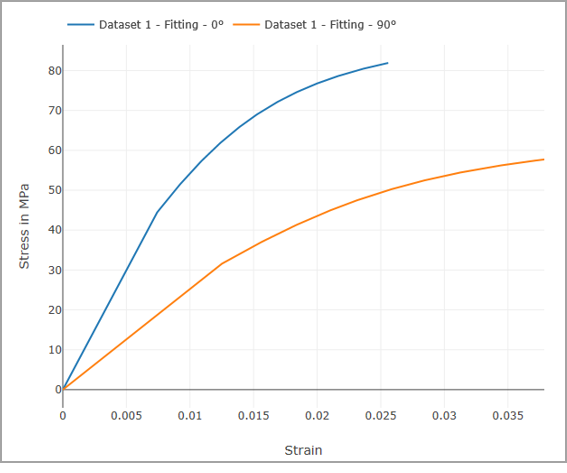
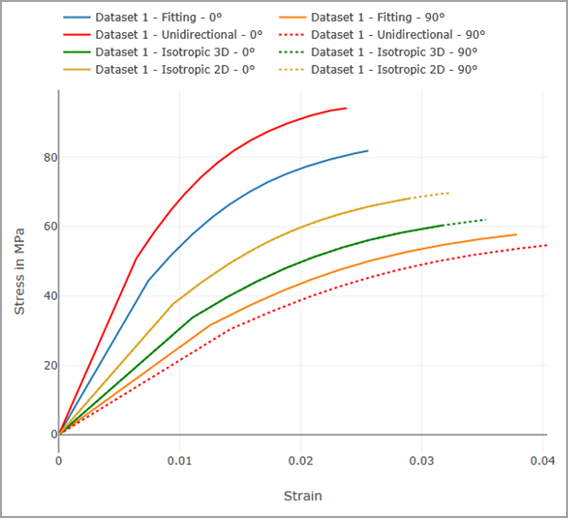
By default, the chart shows the fitted stress-strain curves obtained by evaluating the material model for the values of a11 = a0 and a22 = a90 specified in the Curve Fitting. You can use the advanced options to evaluate the material model for different values of a11 and a22, either predefined (Unidirectional, Isotropic 3D, Isotropic 2D) or User Defined.
Click Complete to open a new window tab with the chart.