


RMS Spectrum (Peak)
Instead of averaging all the FFT spectra, this variant of the RMS Spectrum keeps the maximum magnitude at each frequency across all the spectra.
The formula used for the RMS Spectrum (Peak) calculation in SAS is:
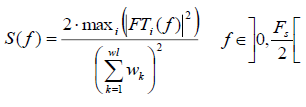
Where,
- FT is the Fourier Transform of the signal (mathematical function).
- wl is the window size.
- w is the analysis window (of length wl samples).
- Fs is the sampling frequency of the analyzed signal.
Refer to the Display Options for the Spectrum Window for the spectrum window to learn how to display the RMS Spectrum.
Note: In versions of SAS prior to
2022 R2, RMS (Peak) corresponds to the settings combination
{Sine wave normalization, Peak calculation}.