RMS Spectrum
The RMS spectrum has a similar calculation procedure to the Autospectrum. The only difference is the applied normalization factor, which compensates for the effect of the analysis window in a different way.
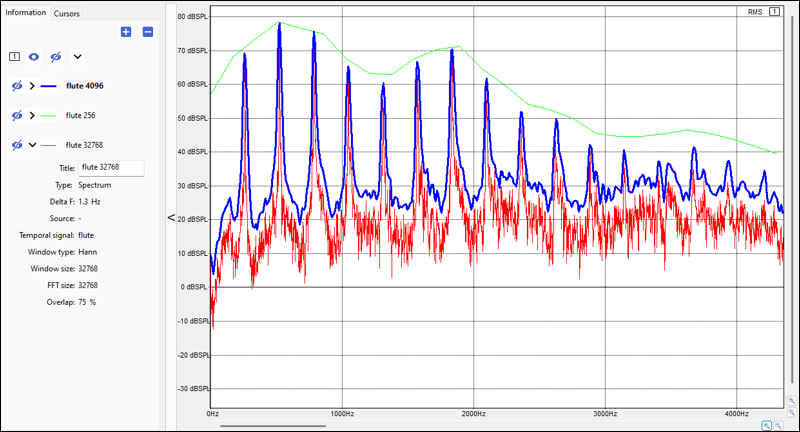
The RMS spectrum does not conserve the overall energy of the original signal (summing the spectrum values will not result in the Leq level of the original signal), but the level of the top of the peaks in the RMS spectrum will be the same as the Leq level of the peak in the original signal.
This means that the level of the tonal components can be easily read from the graph of the RMS spectrum.
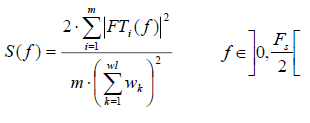
Where,
- FT is the Fourier Transform of the signal (mathematical function).
- m is the number of slices of the signal (determined by the overlap ratio and window size selected by the user).
- wl is the window size.
- w is the analysis window (of length wl samples).
- Fs is the sampling frequency of the analyzed signal.
Tip: The RMS spectrum is better suited to the
analysis of tonal components (sinusoidal/periodic components).
Note: In versions of SAS prior to
2022 R2, RMS spectrum corresponds to the settings
combination {Sine wave normalization, Mean average
calculation}.