


Power Spectral Density (PSD)
Power Spectral Density (PSD) is a way of creating the spectrum not only as a power but as a power density.
PSD is not expressed in the physical unit itself, but in the physical unit per Hz (for example dB SPL / Hz, or Pa2/Hz). This main application of PSD is to obtain comparable quantities when comparing several spectra calculated with different (or unknown) calculation parameters.
The PSD calculation uses Welch estimation. It follows the same principle and formula you have seen before for the autospectrum calculation, but it is then transformed into a density by dividing the resulting autospectrum by the frequency resolution (the step between two frequencies in the frequency vector).
The frequency resolution is simply Δf = fs / nfft.
The formula used for the PSD estimation in SAS is:
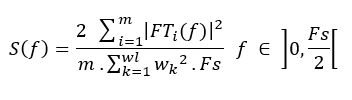
- FT is the Fourier Transform of the signal (mathematical function).
- m is the number of slices of the signal (determined by the overlap ratio and window size selected by the user).
- wl is the window size.
- w is the analysis window (of length wl samples).
- Fs is the sampling frequency of the analyzed signal.
Refer to the Display Options for the Spectrum Window to learn how to display the PSD.