


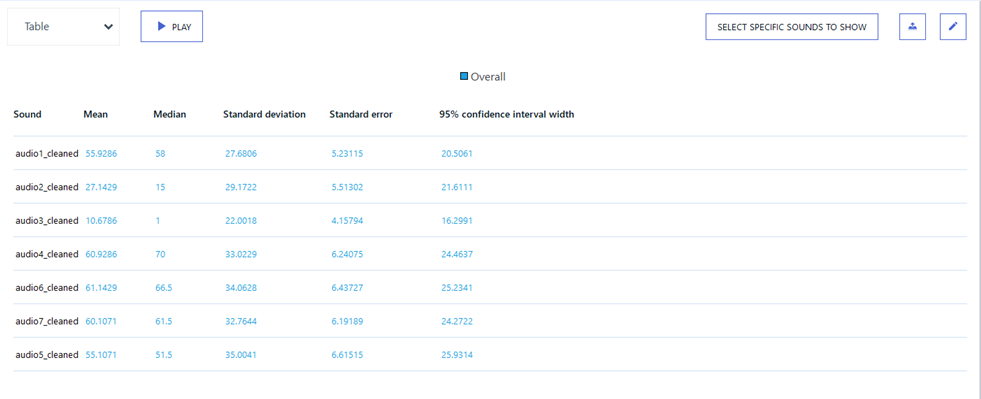
Visualizing Statistics Table
The statistics table provides a set of descriptive statistics: mean, median, standard deviation, standard error and 95% confidence interval for each rated sound.
To Visualize Statistics Table:
-
In the Navigation panel, select Analysis & results.

-
Click
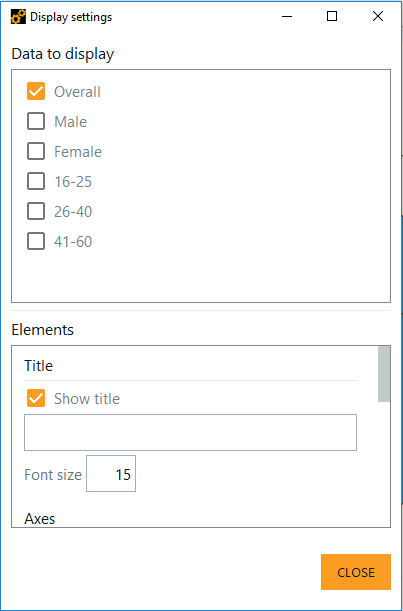
 then, from the Display settings window, select the group data to display
in the chart.
then, from the Display settings window, select the group data to display
in the chart.
In the header row, click a column title to reorder the column by ascending or descending values.

Hover the header row until the moving widget is displayed then, click and drag the widget to enlarge or shrink the column.
Click a row then click Play
 to listen to the sound.
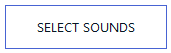
 If there a substantial number of sounds in the project, click Select Sounds to select the sounds to display.
The statistics table visualization is ready for analysis.