Visualizing Spider Chart
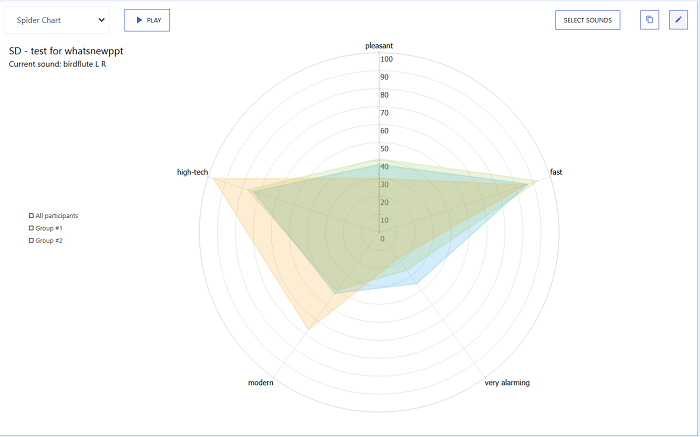
The Spider Chart (for Semantic Differential only) is used to display, on a single chart, how a single sound is perceived over several scales on which it has been rated.
To Visualize The Spider Chart:
-
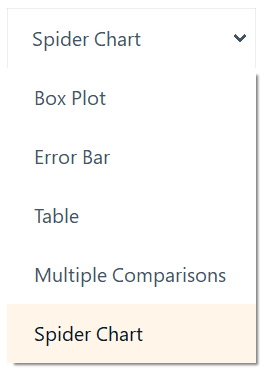
From the plot type drop-down list, select Spider Chart:
-
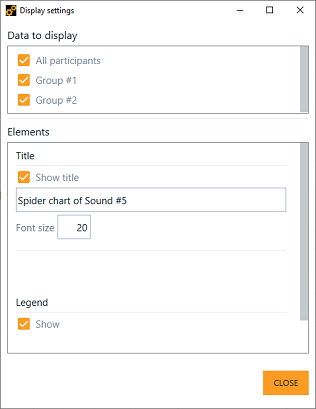
Use
 to select the group(s) to display, and get access to other display settings
The Spider Chart is displayed according to your settings.