


Virtual 3D Photometric Lab
Display
There are several display modes that can be used to filter the information displayed in the 3D view:
Irradiance (radiometric): allows you to see the power distribution on the surface in W/m².
Reflection (radiometric): allows you to see the part of illuminance reflected by the surface in W/m².
Absorption (radiometric): allows you to see the part of illuminance absorbed by the surface in W/m².
Illuminance (photometric): allows you to see the power distribution on the surface in lx.
Reflection (photometric): allows you to see the part of illuminance reflected by the surface in lx.
Absorption (photometric): allows you to see the part of illuminance absorbed by the surface in lx.
By selecting the Decorations check box, you can display the 3D view tool.
For more details, you can view Using 3D view tool.
By selecting the View Mesh check box, you can display the intensity envelope with wireframe.
By selecting the Mesh limit check box, you can display the mesh limit.
By selecting the Legend check box, you can display the legend.
By selecting the Axis check box, you can display the axis.
By selecting the Clip plane check box, you can display the clip plane.
By selecting the Contour check box, you can display the contour.
You can select the Colored check box to color contour.
You can select the Annotation check box to display value of each contour line.
You can select a value in the both level lists. From the Display list, select Mapping to display the XM3 Result.
You can select different display modes described as follows:
|
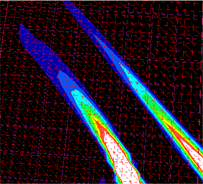
Contouring: triangles are grouped by ISO levels. Each level corresponds to a color of the legend (see Legend in Display group box). |
 |
|
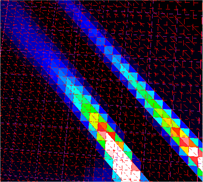
Average: the average value is applied to the whole surface of a triangle A triangle has a single value. |
 |
|
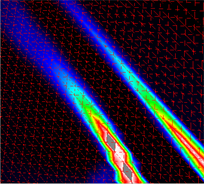
Mapping: The variations between values become smooth thanks to an interpolation between values. It results in a color gradient. |
 |
Transparent
You can move the slider to set the transparency.
Maximum Levels Number
In Maximum levels number box, you can define the maximum levels number to display results.
Xm3 Filtering
By clicking Xm3 filtering..., you can set a standard filtering.
It only uses neighbors without any considerations regarding values of these neighbors.
In Pass number box, you must type the number of times the filtering algorithm is called.