


Parameters of 3D Curve
You can rotate the image, translate zoom, display a wireframe view.
Display
You can select the View Shading check box to display a shading view of the intensity envelope.
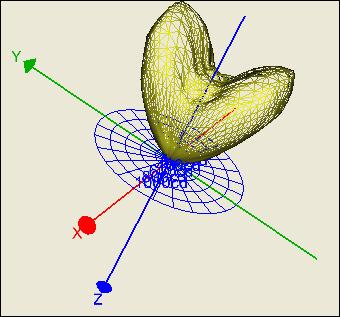
You can select the View Mesh check box to display the intensity envelope with wireframe.
You can select the Decorations check box to display the 3D view tool.
For more details, you can view Using 3D view tool.
You can select the Axis check box to display the axis.
You can select the Grid OXY, Grid OXZ or Grid OYZ check box to display standard planes grid.
You can select Shape to display the shape.
You can select Color to color.
You can click
 to display the level.
 You can click
 to set 3D view preferences.
 For more details, you can view 3D view.
Wavelength (nm)
When you open a Spectral Intensity file, the Wavelength (nm) group box appears.
You can use the slider to change the wavelength.