


Managing the Display
-
If you want to move the map, left-click and move the mouse at the same time.
When moving the mouse over the map, values at the position are displayed in the status bar.
-
If you want to modify the number format, right-click the status bar.
The number format is the number of decimal per value.
- If you want to modify the axis unit of displayed values, right-click the status bar.
-
If you want to change displayed colors, use the color list.
Iso levels displays the image with ISO curves or surfaces.
-
If you want to modify display's parameters, click Tools, Level... or
 .
.You can select a level to modify the value. Press Enter to validate the change.
You can right-click and select Copy to clipboard.
When modifying minimum or maximum value, you can select the Intermediate levels auto-update check box to compute all intermediate values. The minimum and maximum levels are set according to the minimum and maximum luminance detected in the map.
If needed, you can add
 or delete
  a level.Note: Adding or deleting a level on the current scale changes the color threshold of each level as it depends on the number of level added.
 -
Click Default to cancel all modifications.
Check IsoCurve to display the contour lines on the iso levels.
Check Filled to display only the contour lines without the iso levels. The contour lines are then colored according to the corresponding scale level.
Click Linear or Log to switch between a linear or logarithmic scale. Click Load Scale or Save Scale to load or save parameters in a scale file. Format is .scl.
When Iso levels, Black to Color (Custom) or Black to White (Custom Color) is selected in the color list, you can click
 to change the color(s) to display in the Level.
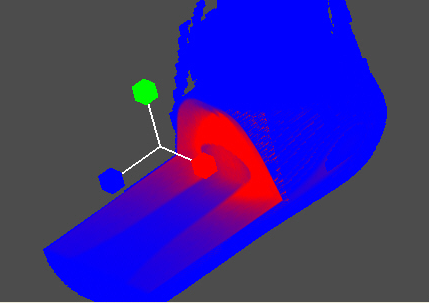
Managing the 3D View
If you open 3D Energy Density Lab in standalone, see Using 3D view tool to know the view commands.
- If you open 3D Energy Density Lab from a CAD software in which Speos is integrated, 3D Energy Density Lab inherits the view commands from the CAD software.
Properties
-
You can select the Decoration check box to display the 3D view tool.
For more details, you can view Using 3D view tool.
- You can select the Axis check box, you can display the axis.
- You can select the Cutting views check box to display the cutting views.
-
You can then select the Show Manipulator check box.
Left-click the axis and move to make a movement. Left-click the axis, press Ctrl and move to make a rotation. Click Up or Down page to change the mode of the used colors.