


Active Overlay

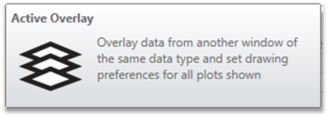
Charts that support active overlay are most XY curve plots, such as FFT PSF Cross Section and Geometric MTF, and the spot diagram plots, such as Footprint Diagram and Spot Matrix Diagram. The Active Overlay feature provides the ability to pull in series data from other plots and plot the data alongside the analysis window's own data series. The data series pulled in from other analysis windows are called "Overlay Series". The overlaid data and axes remain interactive when overlaid into a chart that supports Active Overlay.
Next: