Network Data Explorer Overview
The Network Data Explorer window is divided into the following panes:
- NDE ribbon – Perform many functions of the Network Data Explorer.
- Network Data Selection pane – Select a network data file.
- Cell and Frequency Selection pane – Narrow your selection.
- Data View pane – Display data in table or plot format.
The panes are shown in the following figure. Additional information about each pane follows.
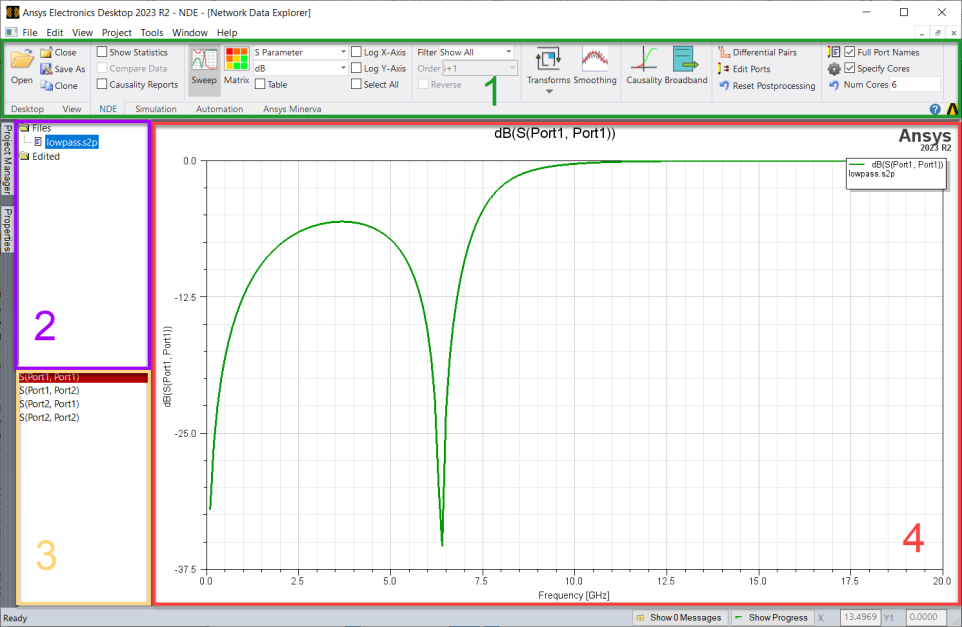
NDE Ribbon
The ribbon provides access to many of the Network Data Explorer's functions and display options.

On this ribbon, you can control:
- Plotting – Determine how the data displays.
- Quantity – Select the type of quantity to display (parameter values, matrix statistics, or causality plots).
- Parameter Type – Choose the parameter for display (S, Y, or Z parameters, Port Impedance, or Gamma).
- Format – Decide the display function to apply to the data (for example, magnitude, phase, dB, real, imaginary).
- Export – Export either SYZ data (*.s1p, *.ts, *.nmf, *.tab, *.m, *.cit) or Broadband data (*.sp).
- Check – Check causality.
- Cores – Enable or disable multithreading.
- Post-Process Selection – Choose between Terminal Data and Differential Pairs, if your design includes differential pairs.
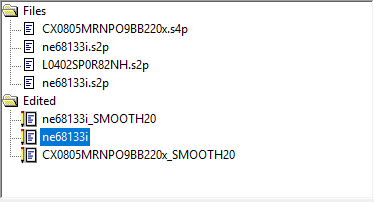
Network Data Selection Pane
Use this pane to view and compare various data sets. Original data sets appear under Files. Click a data set to see it as it was when it was opened. Altered data sets appear under Edited. These data sets appear here when they have been smoothed, transformed, or changed in some way.
Cell and Frequency Selection Pane
Use this pane to choose which frequencies or cells to display. Click Sweep or Matrix to choose a type of plot. Select the Select All check box on the NDE ribbon to select all frequencies or cell entries.
This pane can also list available variations. Selecting a variation activates it and affects table, plot, and statistics displays. When displayed by frequency, the entire matrix is presented in the Data View pane for each selected frequency. When displayed by matrix cell, the data for the individually chosen cells is shown across all frequencies. Select the Select All check box to select all variations.
Given the volume of data in many network data sets, choosing Select All may take a considerable time to generate, especially in Plot view.
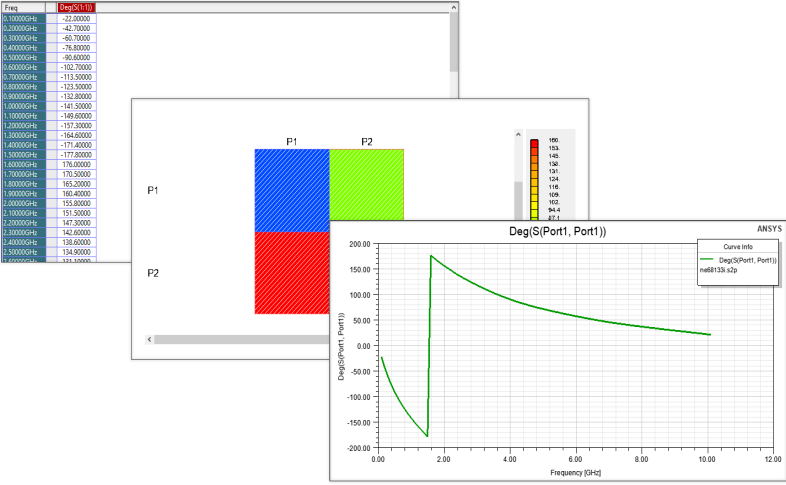
Data View Pane
This pane displays data for Sweep or Matrix in either plots or a table, depending on your selection.