
Causality Checking and Plots
Network Data Explorer can perform a causality check on S-parameter data from any source (solution or file), and provide plots of the results in various formats.
Load S-parameter data into Network Data Explorer, then click Causality on the NDE ribbon. The Causality Options dialog box appears.
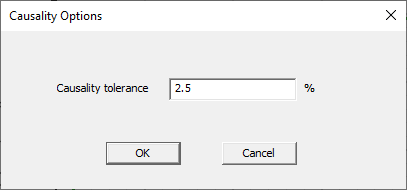
Enter a Causality tolerance and click OK to start the causality check. Depending on the size of the S-parameter data, the causality check may take several minutes to complete. The check's status displays in the Message Manager pane.
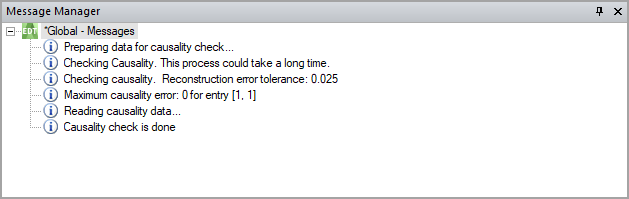
When the check completes, the Message Manager pane updates to display a summary of results.
Reconstruction Error Tolerance – Causality of a frequency response is determined by calculating the generalized Hilbert transform of the data at all frequencies. A causal frequency response is equal to its generalized Hilbert transform. The reconstruction error is the difference between the tabulated data and its transform at a given frequency. The message shows the maximum reconstruction error tolerance for a causal frequency response. The default tolerance of 0.01 is equal to the state-space fitting tolerance.
Maximum Causality Error – The maximum causality error for all port pairs and all frequencies, along with the matrix indices (port numbers) where the maximum noncausality occurs. A noncausal response is one where all matrix entries can be conclusively analyzed, and at least one entry exceeds the causality tolerance. The maximum reconstruction appears first, followed by port numbers in brackets (for example, [port number, port number]). When all results are conclusive but no matrix reconstruction error exceeds the tolerance, the maximum causality error is reported as zero, and no matrix entry is listed.
If the data does not contain enough frequency points to determine whether the data is causal, the Message Manager pane will note an inconclusive result. Network Data Explorer will also report the data set as inconclusive if any cells are inconclusive, even if other entries exhibit causality violations.

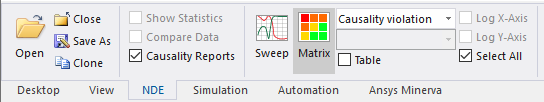
To see the plotted results of the causality check:
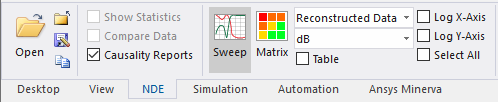
- On the NDE ribbon, select the Causality Reports check box.
- Either click the Matrix icon or select Causality violation in the Parameter type drop-down menu.
- A rectangular plot displays, with dimension N x N and color-coding to indicate the causality status of each port pairing.
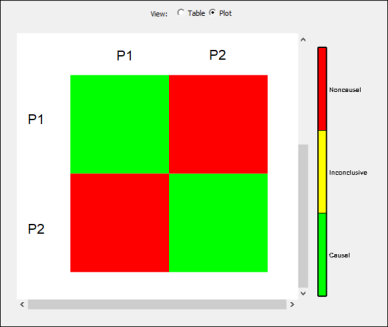
In this plot, the cells go from (Port 1, Port 1) at the upper-left area to (Port N, Port N) at the lower-right corner. The result shows the causality over all frequencies in the data. In this example, the matrix is symmetric, so that both S12 and S21 are noncausal, while S11 and S22 are causal.
To see the details for each frequency, select the Table check box on the NDE ribbon.

To plot the reconstructed frequency response generated by the causality checker:
-
On the NDE ribbon, click Causality Reports.
-
Either click the Sweep icon or select Reconstructed Data in the Parameter type drop-down menu.
-
In the Format drop-down menu, select the desired format. dB is selected by default.
- The plot appears, showing the reconstruction error
at each frequency divided by the tolerance.

The reconstruction error ratio for parameter S12 is positive for frequencies less than about 680MHz, indicating a broad range of noncausal behavior.
- To compare the real part of the reconstructed data to
the real part of the actual data, set the Format to Real.

For a causal frequency response, the actual data (solid line) is in the upper and lower bounds of the reconstruction (dotted lines) at all frequencies.
- To compare the imaginary part of the reconstructed data
to the imaginary part of the actual data, set the Format to Imaginary.
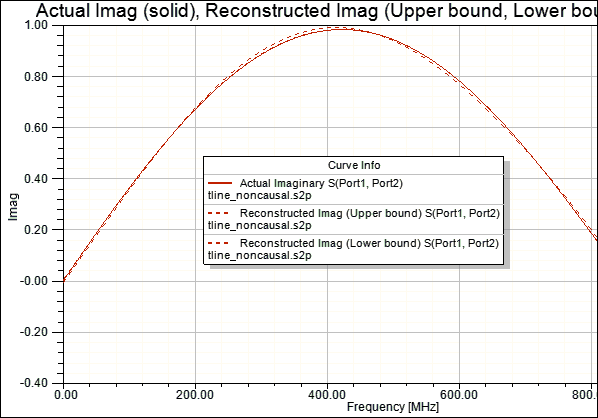
For a causal frequency response, the actual data (solid line) will be within the upper and lower bounds of the reconstruction (dotted lines) at all frequencies.
To view the frequency-dependent discretization error, set the Format to Discretization.

The discretization error occurs because the data is available only at discrete frequencies rather than for a continuous spectrum. A discretization error near or greater than the causality tolerance renders the causality check inconclusive. Data at more frequencies could reduce the discretization error and render the analysis conclusive. This set of data exhibits low discretization errors (<<0.01) at all frequencies, and the causality check is conclusive (conclusively noncausal in this example).