
Creating a New Report
Follow this general procedure to create a new report. See the detailed procedures for the various report types.
- Select Twin Builder > Results > Create Standard Report. You can also right-click Results in the Project Manager pane and select Create Standard Report.
If you have created custom report templates (for example, including your company name or other format changes), you can also create a report based on that template by selecting Twin Builder > Results > Report Templates > PersonalLib > <templateName>. You can also make such changes the default for new reports; right-click a modified report and select Report Templates > Save Settings as default.
The Report dialog box appears.
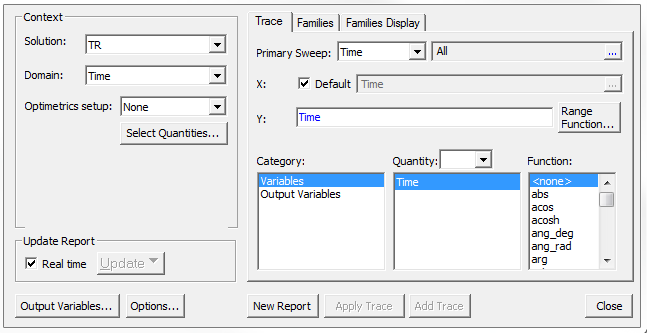
- In the Context section, make selections from the following fields, depending on the design and solution type.
- Solution – The available solutions, whether sweeps or adaptive passes.
- Domain – Domains relevant to the chosen Solution. For transient reports, the domain can be Spectral or Time. For AC reports, the domain is Sweep. For DC reports, the domain is Time.
When Spectral is selected, additional fields display in which you can make settings for plotting spectral domain data.
- Optimetrics setup – All defined Optimetrics analysis setups.
- Select Quantities – Opens the Select Quantities dialog box in which you can select additional quantities for plotting.
- The Update Report sections control whether reports are updated in real time. By default, reports are updated in real time. If the Real time check box is cleared, click Update to update either the current report or all reports manually.
- In the Y Component section of the dialog box, make selections for the following:
- Category – The contents of this list depend on the Solution type and the design. This field lets you specify the category of information for the Y component.
- Quantity
– Lists the Y component items available in the selected Category.
Note:
The Quantity text field can be used to filter the Quantity list by typing in text. It is enabled if the selected category produces a lengthy Quantities list.
- Function to apply to the Y quantities.
- Ytext box –
This text box displays the currently specified Quantity
and Function. You can edit this
field directly.
Note:
The text color shows whether the expression is valid (blue for valid expressions, red for invalid).
- Range - Click Range to open the Set Range Function dialog box. This applies currently specified quantity and function.
- In the X (Primary Sweep) section, make selections for the following:
- Select the Primary Sweep values from the drop-down list.
- If sweeps are available, click
 to display
a dialog box that lets you select particular sweep or sweeps, or all sweeps.
to display
a dialog box that lets you select particular sweep or sweeps, or all sweeps.
- The Families tab provides a way to select from valid solutions for sweeps where
a simulation has multiple variables defined (for example, for a parametric
sweep). If so, the variables other than the one chosen as the X (Primary
sweep), appear under the Families tab with columns for
the variable, the value, and an Edit column with a
button. You can make selections for the following:
- Select either Sweeps display or Available variations display option buttons.
- Sweeps –
Edit the swept variable values. Click in the
Edit field, then choose
the desired variable values in the resulting dialog box.
- Available variations lets you select individual combinations of values via check boxes. Click the Select column heading to select or clear all check boxes simultaneously. Click the variable name column heading to sort the listing in either descending or ascending order.
- In the Nominals field (disabled if none exist in the design) choose either Set All Variables to Nominal, Set All Unswept Variables to Nominal, or to Choose Nominals to open a dialog box in which you can select the variables you want to set to nominal values.
- On the Families Display tab, make selections for the following:
- Choose All Families (default selection) to enable traces for all families selected on the Families tab to be displayed.
- Choose Statistics to select various statistical functions to apply to the traces selected on the Families tab. The selected functions can then be plotted on a new report, or added to the currently active report.
- Choose Histogram to generate a histogram plot based on the family of curves selected on the Families tab. Observe the following general guidelines when generating histograms:
- Use Time as a primary sweep for TR solutions. Use Frequency as a Primary Sweep for AC solutions.)
- For the X-axis definition, you can only use the available Primary Sweep quantity.
- For the Y-axis definition, you can select any available quantity.
- You must select a set of N variations, where N is greater than one, under the Families tab.
- Set the desired Number of bins (the maximum number of rectangles used to represent the number of outcomes). The number of bins must be between 2 and 1000.
- Set the Value to sample at to the instance value of the selected Primary Sweep – in milliseconds for Time, or kiloHertz for Frequency – at which the number of outcomes are computed among all N selected variations.
- Click the Report buttons
to create a new report with the settings you provide, or to
modify an existing report.
- New Report – Adds a report to the Project tree under the Results icon. The new report appears in the Project Manager pane.
- Add Trace – Enabled when you add a new report or select an existing report to modify. Click this to add one or more traces to the report. New traces appear in the Project Manager pane under the report. This is enabled when you have created or selected a report.
- Apply Trace – Updates the selected traces in a report based on further processing or changes. When you edit a trace, this button applies the current values to that trace.
- Output Variables – Opens the Output Variables dialog box.
- Options – Opens the Report Setup Options dialog box. This contains a check box for using the advanced mode for editing and viewing trace components. This mode is automatic if the trace requires it. It also contains a field for setting the maximum number of significant digits to display for numerical quantities.
- Close – Closes the Modify Report dialog box.
- Click New Report to create a new report in the Project tree.
The report appears in the view window. It will be listed in the Project tree under Results, with the default name based on the report category you selected, for example, S Parameter Plot n or Output Variables Plot n. You can edit the plot names in the Project tree and the plot header text in the report synchronizes. Traces within the report also appear in the Project tree. Traces within the report also appear in the Project tree.
Some plots may take time to complete. Saving in such cases after the plot has been created lets you review the plot later without having to repeat the calculation time when you reopen the project later.
- To speed redraw times for changed plots, save. This saves the data that comprises expressions. For example if re(S11)*re(S22) is requested over multiple widths, each of the S11 and S22 are stored when you save. If you do not do a save of a changed plot, the changed version is not stored.