
The Report Dialog Box
The Report dialog box has the following sections:
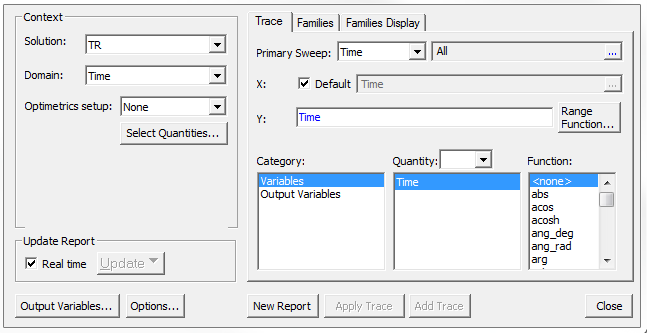
Context Section:
- Solution field – A drop-down list of available solutions (TR, AC, or DC).
- Domain field – A drop-down list of domains. Available selections may include Sweep, Time, or Spectral - depending on the Solution type.
Select Spectral to display additional fields in which you can make settings for plotting spectral domain data.
- Optimetrics setup – All defined Optimetrics analysis setups.
- Select Quantities – Opens the Select Quantities dialog box in which you can select additional quantities for plotting.
Trace Tab
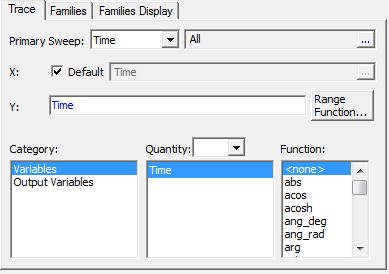
- X (Primary Sweep) section
- This contains a drop-down menu for selecting the values and a browse button for selecting from a list of sweeps (if available).
- Y section
- Value field displays the currently specified quantity and function.
- Range Function – Opens the Set Range Function dialog box. This applies currently specified quantity and function.
- Category – Available categories depend on the solution type and the design. This lets you specify the category of information for the Y component.
- Quantity for Y.
- Function to apply to the Y quantities.
Families Tab:
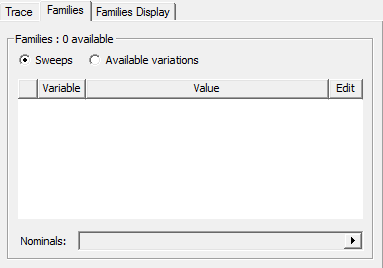
- Each member of a family defines one point on a curve.
- Lists the number of families available.
- Sweeps display or Available variations display option buttons.
Sweeps
lets you edit the swept variable values that appear when you click  in the
Edit field, then choose
the desired variable values in the resulting dialog box. All values
are selected by default.
in the
Edit field, then choose
the desired variable values in the resulting dialog box. All values
are selected by default.
Available variations lets you select individual combinations of values using check boxes. Click the Select column heading to select or clear all check boxes simultaneously. Click the variable name column heading to sort the listing.
- Nominals field (disabled if none exist in the design) lets you Set All Variables to Nominal, Set All Unswept Variables to Nominal, or to Choose Nominals to open a dialog box in which you can select the variables you want to set to nominal values.
Families Display Tab
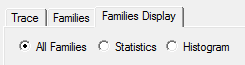
- Contains three option buttons: All Families, Statistics, and Histogram.
- All Families (default) – Enables traces for all families selected on the Families tab to display.
- Statistics – Select various statistical functions to apply to the traces selected on the Families tab. The selected functions can then be plotted on a new report, or added to the currently active report.
- Histogram – Generate a histogram plot based on the family of curves selected on the Families tab. The histogram representation is meaningful as long as the number of variations on which it is based is greater than one. The source of these variations can be from parametric, statistical, or optimization analyses, and even from multiple runs of the same design generated by changing the value of existing design/project variables. Observe the following general guidelines when generating histograms:
- Use Time as a primary sweep for TR solutions. Use Frequency as a Primary Sweep for AC solutions.
- For the X-axis definition, only the available Primary Sweep quantity can be used.
- For the Y-axis definition, any available quantity can be selected.
- A set of N variations, where N is greater than one, must be selected under the Families tab.
- Set the desired Number of bins (the maximum number of rectangles used to represent the number of outcomes). The number of bins must be between 2 and 1000.
- Set the Value to sample at - the instance value of the selected Primary Sweep in milliseconds for Time, or kilohertz for Frequency- at which the number of outcomes are computed among all N selected variations.
Update Report
- Real Time – Select to enable real time updates for all reports. Clear to enable the drop-down menu to Update All Reports or Update This Report. Traces are updated to latest data available if you click Update This Report or after last pass has been solved.
Report Dialog Box Buttons

- Output Variables – Opens the Output Variables dialog box.
- Options – Opens the Report Setup Options dialog box. This contains a check box for using the advanced mode for editing and viewing trace components. Advanced mode is automatic if the trace requires it. It also contains a field for setting the maximum number of significant digits to display for numerical quantities.
- New Report – Adds a report to the Project tree under the Results icon. The new report appears in the Project Manager pane.
- Add Trace – Enabled when you add a new report, or select an existing report to modify. When you add traces, they appear in the Project Manager pane under the report.
- Apply Trace – Updates the selected traces in a report based on further processing or changes. When you edit a trace, this button applies the current values to that trace.
- Close – Closes the Report dialog box.
The evaluated value of an expression is always interpreted in SI units. However, when a quantity is plotted in a report, you have the option to plot values in units other than SI. For example, the expression
1+ang_deg(S11)
represents an “angle” quantity evaluated in radians, though plotted in degree units. To represent an angle quantity in degrees, you would specify units as
1 deg + ang_deg(S11)