
Using the Device Characterization Wizard for a Power MOSFET
The following procedures use an International Rectifier® device as an example. The process is similar for other manufacturer's devices.
At any time during the characterization process, click Save Model to save your progress.
A characterization can be loaded on the Import Model tab.
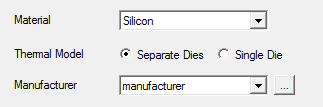
- In the Component Information [1/12] dialog box, enter the component name and material and define the Manufacturer Data. There are three important settings that influence the characterization result:
- Material – Si and SiC MOSFETs are currently supported.
-
Thermal Model – This option specifies whether the model contains one or two thermal networks, which influence the correctness of temperature simulation. It has no impact if thermal simulation is not being used.
-
If the diode in MOSFET is on a separate die, choose Separate Dies and the extracted model contains two internal thermal networks, one for transistor and one for diode.
-
If the diode in MOSFET is its own body diode, choose Single Die and the extracted model contains one thermal network.
Note:Manufacturers usually specify in the datasheet if there is a body diode. One can also determine the number of dies by whether the datasheet contains joint or separate thermal impedance plots for MOSFET and diode.
-
- Manufacturer – These are measurement criteria of dynamic characteristics defined by manufacturers. The information is usually found in the datasheet or device application note from the manufacturer. The detailed documentation describes the specific settings for several vendors. For example, International Rectifier uses the following settings:
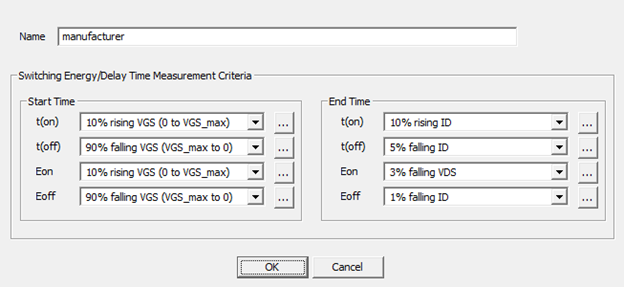
This manufacturer data is critical for the correct characterization of the device. Because each manufacturer uses its own standard to define Ton, Toff, Eon, and Eoff, it is important to measure these quantities the same way in the characterization wizard when fitting the model to output the same. If the settings in this dialog box are different from the actual criteria used by the vendor, the extracted model may be inaccurate even with good validation results in [11/12] the wizard.
If the manufacturer uses a start or stop criterion that is not available in the options, select the point that is closest to that criterion.
- The Nominal Working Point Values [2/12] dialog box sets nominal values at the device's working point. As mentioned above, ideally, these are the operating conditions for the device in the design. Practically, these values are the test conditions on the manufacturer data sheet specified for the switching time and energy information obtained and used for dynamic parameters extraction. These are the conditions for which the parameterized device will best match the measured characteristics. For International Rectifier, generally pick the measurement conditions for the dynamic characteristics. Pick the values of VDD and ID that are mentioned in the table next to the value of the turn-on delay time, td(on). Select the temperature for which you have the output characteristics in the plots section. VGS_on and VGS_off are gate voltages used in manufacturer’s test circuit in which switching dynamics are measured. In the datasheet, VGS_on and VGS_off can be found next to the value of td(on). Cin, the input capacitance, can be found in the datasheet. Cr, the Feedback (Miller) capacitance can be found in the datasheet. It is sometimes referred to as reverse transfer capacitance. If the values cannot be found in the datasheet, 0 (zero) is a good default value, as the characterization tool will then pick a value using the other device characteristics. Click Next to continue.
- On the Breakthrough Values [3/12] dialog box, check Disable Breakthrough Model, as the breakdown characteristics data is rarely available in a datasheet. Click Next to continue.
- The Half-Bridge Test Circuit Condition [4/12] dialog box sets up the test circuit under which the model’s dynamic characterizations are measured. It is important to have the same test circuit used by the vendor when the datasheet values are measured.
The required data can generally be found in the datasheet and device application note from the vendor.
- Rg is the internal gate resistance found in the datasheet. This value is used as an initial value during the dynamic characterization. It is not the internal gate resistance the characterized device ends up with.
- R_tot is generally omitted in the datasheet; 5% of Rds in [2/12] is a good default for MOSFET. If R_tot is provided in the datasheet and the device is a MOSFET module that contains two MOSFETs in series between two external pins, use half of the R_tot value in the datasheet.
- L_tot is generally omitted; 0 (zero) is a good default. If L_tot is provided in the datasheet and the device is a MOSFET module that contains two MOSFETs in series between two external pins, use half of the L_tot value in the datasheet.
- L_extern is given by Ls in the test conditions for td(on). If the value is not there, 2 nH is a good value to use. The characterization wizard parameterizes this value to find a good fit with the dynamic data.
- Rg_on and Rg_off are found next to the values of the switching energies td(on) and Eon.
- Cge ext is generally omitted and a default value of 1e-12Fused.
- CLoad is sometimes found on the datasheet as load capacitance. Use 0 (zero) if it is missing.
- RLoad is the load resistance value when a resistive load test circuit is used. When its check box is cleared, use an inductive load test circuit.
- Test Circuit (DUT location) defines the location of the device under test (DUT) in the test circuits. Together with RLoad, it is used to define different configurations of the test circuit.
- If the RLoad check box is selected, the drop-down options are Lower Transistor and Upper Transistor.
- If the RLoad check box is cleared, the drop-down options are Lower Transistor, Upper Transistor, and Module (Halfbridge).
You can see the test circuits used after selecting Test Circuit in the last step,then Finish.
Load type and Test Circuit (DUT location) usually appear in either the datasheet or application note from the manufacturer. When multiple test circuits are provided, use the one for dynamic characteristics (switching time and energy) measurement.
In general, the Module (Halfbridge) setting should be used only for MOSFET modules that contain two MOSFETs in series between two external pins.
- When finished setting values, click Next to continue.
- Use the Transfer Characteristic
Id=f(Vgs) [5/12] dialog box to parameterize the threshold
voltages and transconductance of the MOSFET. Enter the data with SheetScan.
To do so, click Load characteristics from Dataset
Manager
 above the table and click SheetScan.
Load the graphs in graphic files captured from the manufacturer data sheet using the Picture > Load
picture command.
above the table and click SheetScan.
Load the graphs in graphic files captured from the manufacturer data sheet using the Picture > Load
picture command.
For an International Rectifier device, the data sheet plot shows ID=f(VGS).
- Select a coordinate system (Coordinate System > New) and define it on the plot. To do so, you must select three points. Typically, you should use the bottom-right, bottom-left and top-right points of the plot grid. Click Point1, Point2 and Point3 and select the corresponding points on the graph. Enter the corresponding X-Values and Y-Values for these points (read from the plot’s X-axis and Y-axis labels) in the table and click OK to finish defining the coordinate system.
- To define the first characteristic, select
Curve > New and give names to
the X-axis and Y-axis in the Curve Settings
dialog box. Click OK when finished.
Note:
You can save SheetScan work for later adjustment and reuse.
- Make sure to note the temperature given on the plot. Then select several points on the curve starting with the lowest X-value. Pick at least four points. When done, click File > Export and click Dataset in the resulting Save dialog box.
- If a plot at a different temperature is available, repeat steps a, b, and c to record additional data.
- When finished, click File > Exit to exit SheetScan, saving the scan setup information, if desired.
- In the Datasets dialog box, select the data to use at the nominal temperature and click Done. The data is transferred to the Characteristic Data table in the Transfer Characteristic [5/12] dialog box. Make sure to enter the correct values for temperature and Vce, which you recorded during the SheetScan measurements.
- If you also recorded plot data for a
different temperature, click Add new characteristic
(
 ) in the
top right corner and click Load characteristics
from Dataset Manager (
) in the
top right corner and click Load characteristics
from Dataset Manager ( ) above the table to load the additional
data. Select the plot in the first tab for the Nominal
Temperature field of the Fitting
Characteristic Order panel. If you added a second set of data
for a different temperature, select this plot for the Different Temperature field, or select
Not Used, if data is available
only for one temperature.
) above the table to load the additional
data. Select the plot in the first tab for the Nominal
Temperature field of the Fitting
Characteristic Order panel. If you added a second set of data
for a different temperature, select this plot for the Different Temperature field, or select
Not Used, if data is available
only for one temperature.
- Click Start Fitting to fit the characteristics and examine the resulting plot to check the match of the fit. Click Next to continue.
- Use the Output Characteristic Id=f(Vds) [6/12] dialog box to parameterize more of the MOSFET's output characteristics. Ideally, enter the output characteristics at Vgs=VGS_on (Full Saturated Branch) and for Vgs at a lower voltage (Semi Saturated Branch), for both the nominal temperature and at a different temperature, using SheetScan as described in step 5. Make sure to note the value of Vgs and the corresponding temperature for each curve.
For International Rectifier, the datasheet plot shows ID=f(VDS). The output characteristics of the semi-saturated branch are often missing at a different temperature.
- Add up to four characteristics, making sure to identify them with the correct values of VGS and temperature.
- Select the plot at the nominal temperature and with Vgs=VGS_on for the Full Saturated Branch (Tnom) field in the Fitting Characteristic Order panel, and one at a lower value of Vgs for the Semi Saturated Branch (Tnom) field, or select Not Used, if the data is not available. Repeat this at a different temperature for Vgs=VGS_on and at a lower Vgs in the corresponding Full Saturated Branch (Tdiff) and Semi Saturated Branch (Tdiff) fields. The fit will be better if the current does not saturate much for the semi-saturated curve, but the fitting algorithm will work with either option.
- Click Start Fitting to start the fit and examine the plot to check the match of the fit. Click Next to continue.
- Use the Drain-Source Diode Characteristic If=f(Vf) [7/12] dialog box to parameterize the DC characteristics of the diode. Ideally, you should enter the diode forward characteristic If(Vf) at both the nominal temperature and at a different temperature using SheetScan as outlined in step 5. Make sure to note the value of the temperature for each curve.
For International Rectifier, the datasheet plot shows ISD=f(VSD).
- Generate two characteristic data sets, one at the nominal temperature and one at a different temperature, being sure to identify them with their corresponding temperatures.
- Select the plot at the nominal temperature in the Nominal Temperature field of the Fitting Characteristic Order panel, and the plot at the different temperature in the Different Temperature field, or select Not Used, if the data is not available.
- Click Start Fitting to start the fit and examine the plot to check the match of the fit. Click Next to continue.
- Use the MOSFET Thermal Model [8/12] dialog box to parameterize the thermal impedance of the MOSFET. Do one of the following:
- If the data sheet provides extracted values for ri and ti, which is the case for International Rectifier, enter these four value pairs in the Use Fraction Coefficients table, click Start Fitting, check the plot and press Next to continue.
- If the data sheet does not provide extracted values for ri and ti, select Use Transient Thermal Impedance and enter the plot data for the thermal characteristics using SheetScan per the instructions given in step 5. The plot will show the impedance as a function of time. Make sure to adjust the scale of the coordinate system in SheetScan to logarithmic if needed. Select Start Fitting to start the fit and examine the plot to check the match of the fit. Click Next to continue.
For additional information about the MOSFET Thermal Model, see IGBT Thermal Model because the information is valid for both thermal models.
Sample the "single pulse" curve when multiple transient thermal impedance curves are presented in the data sheet.
- Use the Drain-Source Diode Thermal Model [9/12] dialog box to parameterize the thermal impedance of the diode.
- If the data sheet provides extracted values for ri and ti, which is the case for International Rectifier, enter these four value pairs in the Use Fraction Coefficients table, click Start Fitting, check the plot, and click Next to continue.
- If the data sheet does not provide extracted values for ri and ti, select Use Transient Thermal Impedance and enter the plot data for the thermal characteristics using SheetScan per the instructions given in step 5. The plot will show the impedance as a function of time. Make sure to adjust the scale of the coordinate system in SheetScan to logarithmic if needed. Select Start Fitting to start the fit and examine the plot to check the match of the fit. Click Next to continue.
- Use the Dynamic Model Input [10/12] dialog box to parameterize the dynamic characteristics of the power MOSFET. You can select to fit for the switching energies (Eon and Eoff) and switching times (Ton and Toff). The nominal point has to be fit, so the data has to be available. For more information about the input settings, see Dynamic Model Input. The Advanced Settings button allows more control over the characterization process, but should not be necessary to change for most devices. Check the Advanced Settings documentation for more information. For more information about the model settings, see Dynamic Model Input.
- Click Measurement to open the Measurement Data dialog box and make sure the settings correspond to the ones for the manufacturer of the device being characterized. For example, for International Rectifier, use Eon and Eoff from the data sheet as the goal settings for Eon and Eoff. Use td(on)+tr as the goal setting for t(on), and td(off)+tf as the goal setting for t(off).
- Set weights and desired residue for the goals. By default, weights are set equally to 1, and residue is 5% to provide good trade-off between accuracy and extraction time.
- If data is available at different temperature, add it to the dT row.
- If data is available at a different value of VDS, add the lower value of VDS to the nV row and the higher value of VDS to the pV row.
- If data is available at a different value of Id, add the lower value of Id to the nI row and the higher value of Id to the pI row.
- Optionally, the Adv. Settings button allows for more control over the characterization process, but should not be necessary to change for most devices. Check the more detailed description for more information.
- T_ON_MAX – total On-switch signal settling time (trigger to 1% falling VDS)
- T_OFF_MAX – total Off-switch signal settling time (trigger to 1% falling ID)
- H_ON – On-switch signal acquisition time
- H_OFF – Off-switch signal acquisition time
For low and medium power devices, the default settings should be sufficient to ensure correct data measurement. For high power devices, the maximum value might be increased (2-5 times). The actual acquisition time is increased by the process if necessary.
- The parameter extraction process uses three optimization routines to determine values for the dynamic device parameters. The first routine is an iterative loop that uses a 1D search method to progressively refine its approximation. To enable it, set LOOPS_A to an integer number larger than 0 (zero). MASKPAR_A contains the names of the optimization parameters to reach a good convergence. RESORD_A sets how the residue is defined 0 (zero) for the maximum error, 1 for the average error and 2 for the root mean square error. RESTOL_A defines the value under which the residue must get to leave the loop with a good solution.
- The second and the third loop (B and C) use a Jacobian matrix method. LOOPS_B and LOOPS_C set the number of pre-loops taken for the second and third loop; usually 1 will suffice. MASKPAR_B and MASKPAR_C contain the names of the parameters changed by the characterization tool to find a better fit during the second and third loop. MATRIX_B and MATRIX_C set the maximum number of Jacobian recalculations, while ZEROFN_B and ZEROFN_C set the maximum number of constant Jacobian calculations. RESLOC_B and RESLOC_Cset the maximum number of relaxation which occurs within a constant Jacobian calculation. RESORD_B and RESORD_C set how the residue is defined: 0 (zero) for the maximum error, 1 for the average error and 2 for the root mean square error. RESTOL_B and RESTOL_C define the value under which the residue must get to leave the second and the third loop with a good solution. However, if the values of RESTOL_B and RESTOL_C are left at zero, the simulation will use the Res [%] values from the Dynamic Model Input table.
- Click Extraction to start the fit. A dialog box showing the progress of the extraction appears. Upon completion, another dialog box informs you that extraction is complete. Click OK to return to the Dynamic Model Input [10/12] dialog box.
- Click Next to continue.
- Use the Dynamic Parameter Validation [11/12] dialog box to validate the dynamic extraction. The actual values of the switching times and energies for the parameterized device are calculated. Enable the conditions that you need to check and click Validate. Click Next to continue.
- Use the Model Parameters [12/12] dialog box to browse the extracted parameters.
- To generate an .sml file of the model, click Create SML.
- To place a characterized device in the Twin Builder project, click Place Component and click Finish.
- To generate a test circuit using the characterized device, click Testcircuit and click Finish.