Creating Vector Field Plots
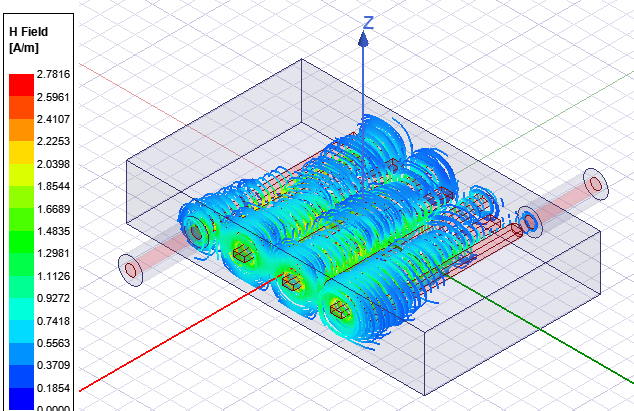
A vector plot uses arrows to illustrate the magnitudes
of the x-, y-, and z-components of field quantities. Vector plots can
be created on surfaces or volumes. The vector plots calculates a good initial spacing (min, max, and spacing range). The initial min, max spacing is based on a percentage of the plot geometry size and they are in model units. You can edit the vector min and max threshold spacing and the arrow representation.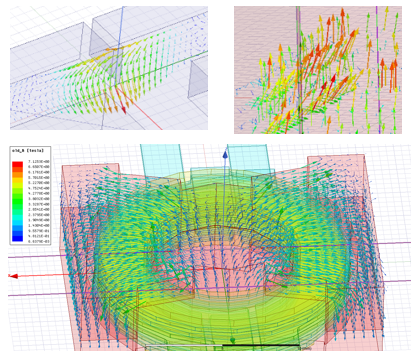
- Do one of the following:
- To create a vector surface plot, select the faces on which you want to plot the fields.
- To create a vector volume plot, select the objects within which you want to plot the fields.
- Click
- On the Plot
Fields menu, click the vector field quantity you want to
plot.
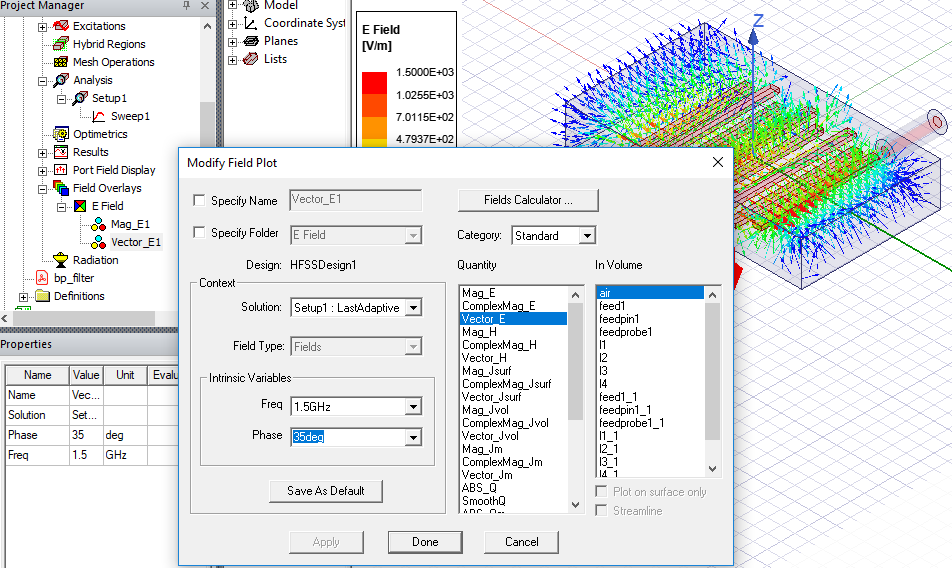
- Follow the
If you select a vector quantity when creating a plot, you can also check Streamline for the plot.
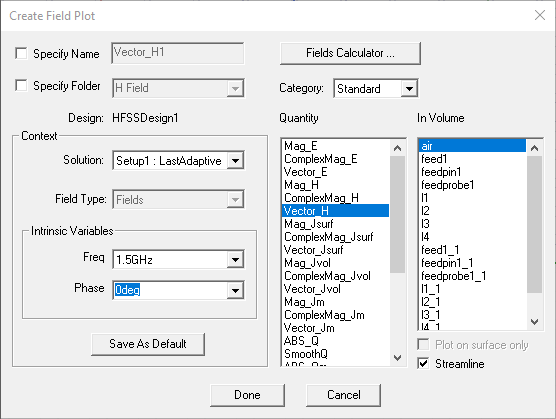
Notes for creating Streamline plots:
- Before creating the plot, select both starting and ending edges (in 2D) or surfaces (in 3D).
- In the Creating Field Plot menu, select "In Volume: Region" which is the volume in which the streamlines will appear and is outside of the sources.
- After the plot is created, on the Attributes/Plot
tab reduce "Seeds density" to show more streamlines. If no streamlines
appear, reduce this by a factor of 10 (or 100) because the default seeding
was too large.