


When viewing an evaluator's details you can view a plot of the evaluator's performance metrics to gain insight into how the resource is being utilized.
Performance metrics are displayed on the Monitoring tab:
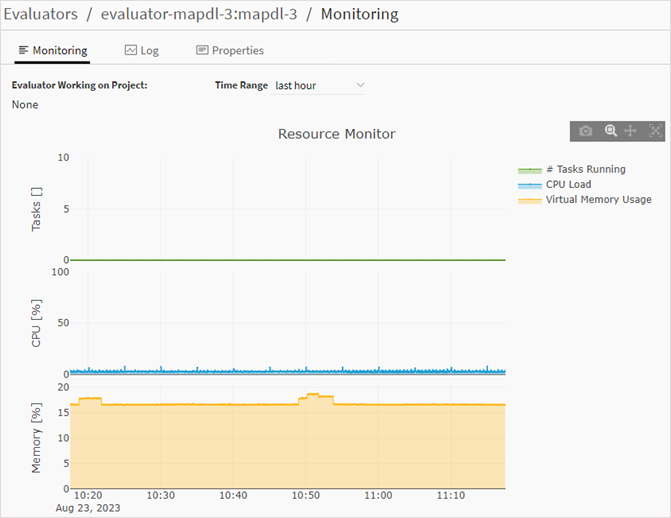
Performance Metrics
The following metrics are available:
Evaluator Working on Project. Name of project being evaluated (if any)
# Tasks Running. Number of tasks running on the evaluator
CPU Load. The percentage of the CPU that is being used or waiting to be used by processes
Virtual Memory Usage. The percentage of virtual memory being used
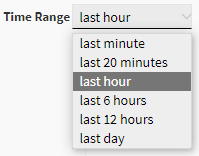
Select a Time Range
By default, metrics are shown for the last hour. To view metrics for a different time period, make a selection from the Time Range drop-down.
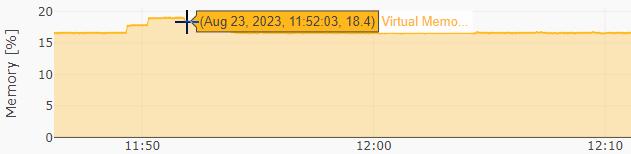
View Metrics for a Point in Time
To view information for a single point in the time range, hover your cursor over the point on the plot line of the metric you want to see. Details about the point are displayed in a tooltip.
Download the Plot as a PNG
To download the currently displayed plot as an image (PNG) file, click ![]() on the plot window toolbar.
on the plot window toolbar.
Zoom, Pan, or Scale the Plot
Use the toolbar in the upper right corner of the plot window to zoom, pan, or automatically scale the plot view.
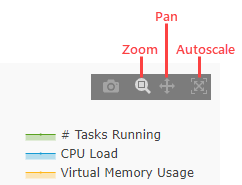
To zoom a particular area, click the Zoom button and then click and drag a selection window around the area of interest.
To pan the view, click the Pan button and then click and drag in the plot view.
To automatically magnify the plot view to get a closer look at plotted data, click the Autoscale button.