


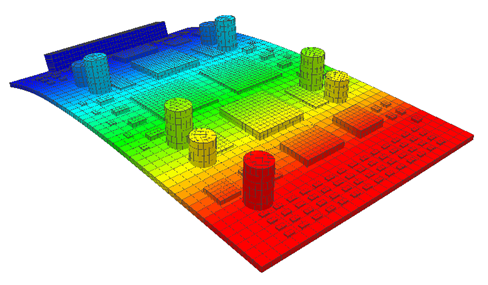
The Sherlock 3D Viewer is a powerful tool for studying the results generated by Sherlock's finite element analyses: Harmonic Vibe, ICT, Mechanical Shock, Random Vibe, and Thermal Mech. The Viewer displays the model and the analysis results using an intuitive Color Scheme to convey the results for each element in the model.
You can fully interact with the 3D model and the Color Schemes to create a visual presentation that best suits your needs:
Choose from a list of Color Schemes to visualize displacement, stress, strain values, composite scores, as well as various material properties.
Hover over individual elements to view exact strain or stress values.
Move, rotate, or zoom your view of the model.
Magnify the level of warping so you can easily see displacement effects.
Export a publication-ready image of the model or a 3D interactive model for PDF.
In Windows, you may launch the 3D Viewer several ways:
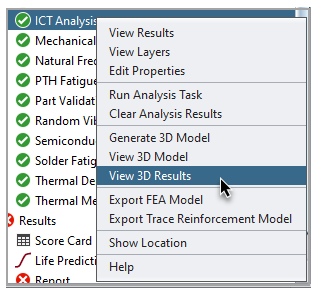
From Sherlock's Project Tree: As an example, if you wish to view the most recent ICT results, right-click the ICT Analysis entry in the Sherlock Project Tree for a given CCA and select the View 3D Results menu item.
From the Results Viewer: To view saved 3D results from the Sherlock Results Viewer, use the View menu to select the desired 3D results (if any) saved with the results snapshot.
From your PC Desktop: To view saved 3D results directly from the desktop, locate the 3D results file in the file system (saved either automatically in the Sherlock project directory or in a folder designated using the Save As menu option). All 3D result files are assigned the .dfr-3d file type which is automatically registered with Windows and associated with the Sherlock 3D Viewer during the Sherlock installation process. As such, you may simply double-click a 3D results file with that suffix to launch the Sherlock 3D Viewer and automatically open the selected result file.
From Sherlock 3D Viewer: To view saved 3D results in a Sherlock 3D Viewer that is already running, use the File > Open File menu option to open the saved results file, or simply drag-and-drop the file onto the viewer window. In either case, any currently open 3D results will close automatically, and the new 3D results will be displayed.
Linux
If Sherlock is running on Linux, launch the 3D Viewer using
the command: runSherlock -3dViewer
Sherlock's 3D Viewer provides several convenient ways to view the 3D models and analysis results. The main viewing area shows the 3D model (which includes only the features you have selected) along with the overlaid color scheme which conveys the analysis results. You can pan, rotate, and zoom the 3D display as needed using simple mouse controls.
Tip: Press the Help icon  for
a list of view-navigation mouse controls.
for
a list of view-navigation mouse controls.
Customizing the View Using the 3D Viewer Panels
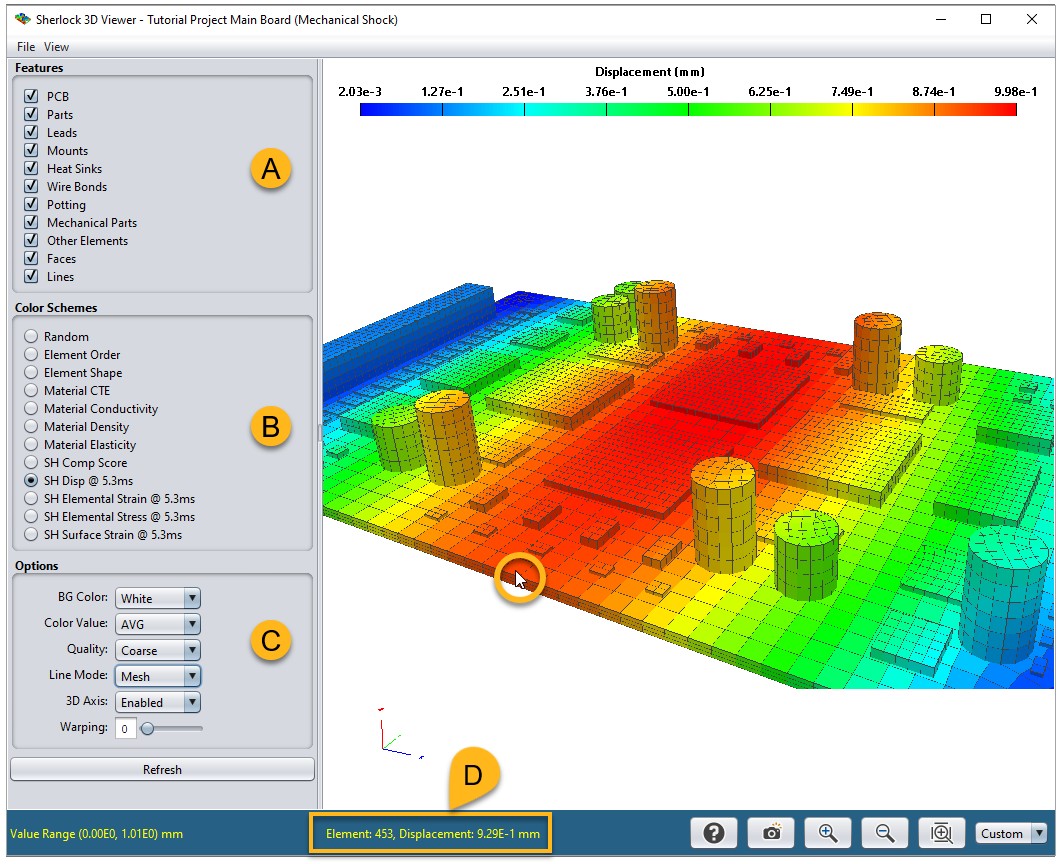
The Viewer panels (A, B, & C in the image above) provide options for you to customize the view so the results are displayed in a way most helpful to you:
Features: (A, above) Here you select which model features you want displayed- such as the PCB, parts, leads, and so on. Typically, all features are selected, but you are free to choose whichever ones suit your needs. Click the Refresh button to apply your selection.
Tip: Remember, after selecting any option(s) in the panels, you must click the Refresh button to apply the new settings.
Color Schemes: (B) This panel allows you to select what kind of information (from the results file) you want the Color Scheme to display. In the example above (generated from a Mechanical Shock analysis), the Color Scheme displays the displacement that occurred at the 5.3 ms mark.
The list of available Color Schemes varies, depending on the specific analysis type and how the analysis was configured. As always, click the Refresh button to apply your selection.
Once you have selected and applied a Color Scheme, you can hover the mouse over any portion of the board to see the value associated with that color. (This feature works for Color Schemes based on element properties, material properties, or FEA results. It will not work when Random is selected.) In the image above, the mouse is pointing to Element 453 which has a displacement value of 9.29E-1 mm (see D). By left-clicking that location, you can send that information to the 3D Viewer Console. If the 3D Viewer Console is not open, simply select in the 3D Viewer window.
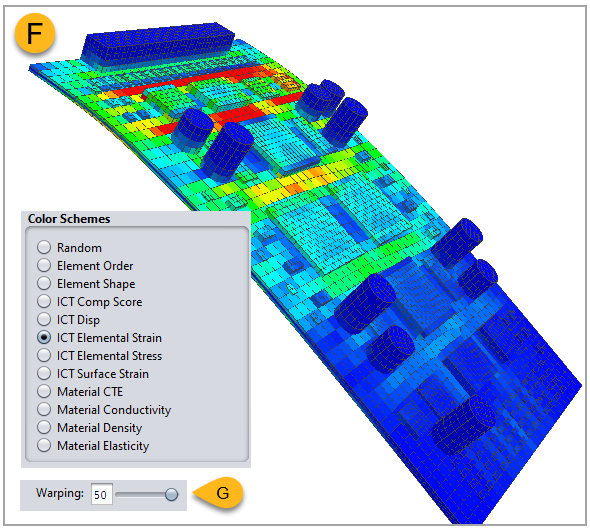
By default, the displacement values computed for a specific analysis-type are applied to all nodes in the display model. For example, if you are viewing the results from an ICT analysis and have selected the ICT Disp results in the Viewer, then the model will be bent and colored to indicate the computed displacements. If, on the other hand, you select the ICT Elemental Strain results, then the model will be bent to indicate the computed displacements, while the colors indicate the computed strains. (See F below.) In this way, a single 3D plot can indicate both displacement and strain results.
Tip: Another way to customize Sherlock's use of colors is to experiment with the Color Settings option in the View menu. This determines the results-range of the minimum-results color (blue) and of the maximum-results color (red). In other words, you can adjust the width of the blue and red regions at each end of the color spectrum. See Color Settings below.
Note: In the 3D Viewer, when viewing any of the color schemes related to material properties (Material CTE, Material Conductivity, Material Density, and Material Elasticity), the values represented are for the material at 20°C only.
Options: This panel (C, above) provides display options for altering the 3D rendering of the model. You must click the Refresh button to apply any changes you make.
BG Color: (White, Blue, Black, Gray) Set the Viewer's background color.
Color Value: (AVG, MIN, MAX) Specify whether the color scheme displays the average, minimum, or maximum result for each element. Default is AVG.
Quality: Specifies the number of triangles or quads used to render the results data. The Coarse setting displays a single element for each element used in the 3D analysis model and is suitable for most purposes. The Fine setting displays 4 or 5 elements for each modeled element, resulting in a more uniform look.
Tip: Typically, Coarse is used for general viewing and Fine is used for publication-ready images.
Warping: Since displacement values in the results file can be relatively small, the Warping factor is provided (G, above) to amplify displacement, making it easier to see. A warping factor of 0 eliminates all displacement results. A warping factor of 1 shows the actual results, and a warping factor between 2 and 50 multiplies the displacement values by the given amount.
Line Mode: (Outline, Mesh, or None) If you want black lines to outline the edges of the board only, select Outline. Select Mesh to mark the outline of each element. Select None to turn off this feature altogether.
3D Axis: (Enabled, Disabled) If you want the X/Y/Z axis indicator to appear in the Viewer, select Enabled.
3D Viewer Menu
The 3D Viewer's main menu (near the top of the window) contains two items: File and View.
File
Open File: Open a .dfr-3d file (Sherlock 3D Results file) or .inp file (Abaqus input file) in the 3D Viewer.
Recent 3D Files: Select a recently viewed file from the list.
Save As...: Save .dfr-3d file in another location and/or with another name. Only the analysis results and 3D model are saved, not the Viewer settings.
Export Image: See Exporting 3D Images below.
Close Viewer: Closes the 3D Viewer.
View
Model Info: Displays basic information about the 3D model: Number of solids, number elements, number of lines, and number of faces.
Color Settings: This opens the Color Settings window shown below. Here you can set the Max and Min values which affect how Sherlock displays the Color Scheme. When these values are applied, results above the Max value are displayed as red on the model. Results below the Min value are blue. The normal color spectrum is applied to values in between. In effect, adjusting the Min and Max values reduces or increases the width of the blue color (minimum) and of the red color (maximum results) when Sherlock displays the results.
Each result-type (displacement, strain, stress, and so on) has its own tab (E, below) so you can apply a distinct setting for each.
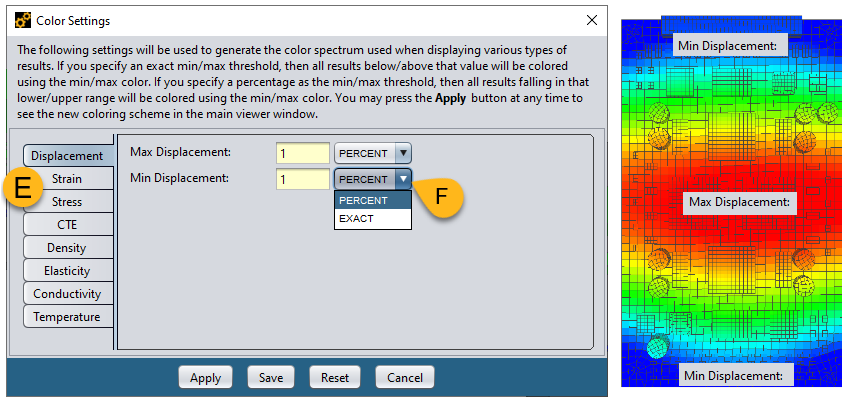
Use the dropdown menu (F) to specify whether the Max/Min value you entered is a PERCENT or an EXACT number.
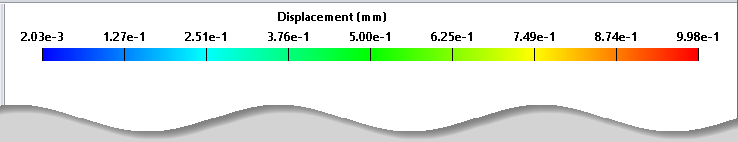
PERCENT: The percentage is based on the number of results, not the range of the results. Example: If Sherlock generated ten thousand displacement results for a given analysis and Max Displacement is set to 1 PERCENT, the highest 100 results will be displayed as red, regardless of the displacement range (2.03e-3 to 9.98e-1 mm in the example below).
EXACT: This means the number entered represents an exact value, assuming the same units displayed in Viewer (mm in the example above). If, for example, you enter 1.28e-1 EXACT in the Min Displacement field, any results below 1.28e-1 mm will be displayed as blue.
You may press the Apply button at any time to see the new coloring scheme in the main Viewer window.
Zoom Commands: Basic zoom commands: Zoom Out, Zoom In, Zoom Fit. Functions the same as the zoom icons in the Toolbar.
Use View as Default: Sets the current view of the model (position, orientation, and level of zoom) as the default view which is used for initial 3D Viewer startup and when you select Default in View Selector in the Toolbar.
Reset Default View: Restores the view to the default setting. See above, Use View as Default.
Console: Displays the Sherlock 3D Viewer Console.
Memory: Displays the Memory Monitor for the 3D Viewer. See The 3D Viewer and Memory Management.
Help: Displays basic reminders how to navigate the view with your mouse.
3D Viewer Toolbar
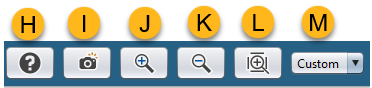
H. Help: Displays basic reminders how to navigate the view with your mouse.
I. Export Image: Opens the Export Image dialog. See Exporting 3D Images below.
J. Zoom In
K. Zoom Out
L. Zoom to Fit: Adjusts zoom level so model fits the display size.
M. View Selector: Choose among several preset view options.
Tip: To set the current view as the default view, click View in the Viewer's main menu and select Use View as Default.
You can create publication-ready image files at any time by clicking the camera icon and designating a destination file. Alternatively, you can select the File > Export Image menu item. In either case, the Export Image window opens, as shown here, allowing you to specify the location and name of the file to be exported. Click the Browse button to find the appropriate location and/or name of the file to be exported.
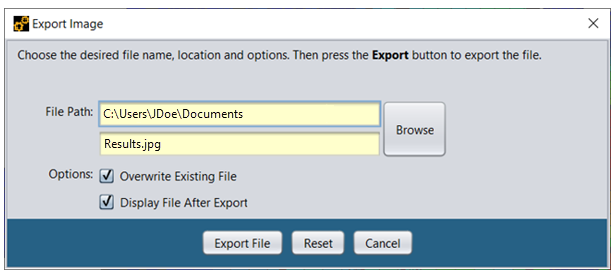
The filename suffix you enter specifies the export file format. The following formats are supported:
| *.jpg or *.jpeg - JPEG image file format |
| *.png - Portable Network Graphics file format |
| *.pdf- Portable Document Format |
The JPEG and PNG file formats provide a 2D representative of the circuit card results that you can incorporate into reports, presentations, and email messages. The PDF file format provides a standard 3D representation of the circuit card and the results you can be view interactively using an Adobe PDF viewer or a compatible PDF viewer that supports the Adobe 3D PDF standard.
Select one or more of the processing options to customize the export process:
Overwrite Existing File: If selected, Sherlock will automatically overwrite any existing file with the same name without prompting you for confirmation.
Display File After Export: If selected, Sherlock will attempt to display the exported file using whatever application is associated with the file name suffix in Windows. For example, if a PDF file is generated, then the default PDF viewer will open to display the exported file.
The Sherlock 3D Viewer may run slowly when analyzing large projects even if the computer has ample amounts of memory. This is likely a Java issue.
If you encounter an error message that the 3D Viewer has run out of memory, you can allocate more memory to the 3D Viewer in the Launcher Settings. From Sherlock's Main Menu, click Settings > Launcher. Refer to Launcher Settings for additional information.