


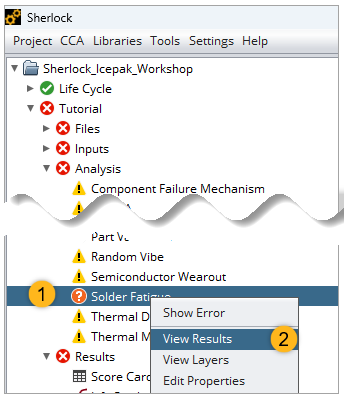
When the analysis is complete, right-click Solder Fatigue in the Project Tree and select in the context menu.
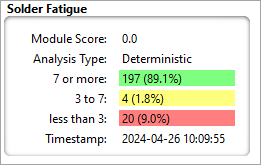
In the Summary tab, the Solder Fatigue section shows a module score of 0.0.
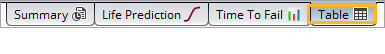
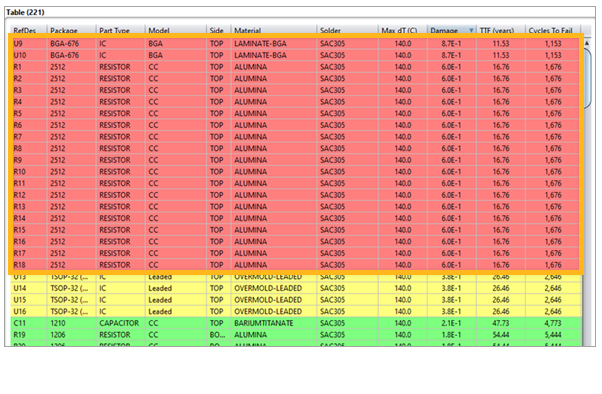
Click the Table tab at the bottom of the display to see each component and their results in the Cycles-to-Fail table.
Notice the components highlighted in red, meaning these parts failed the Solder Fatigue analysis.
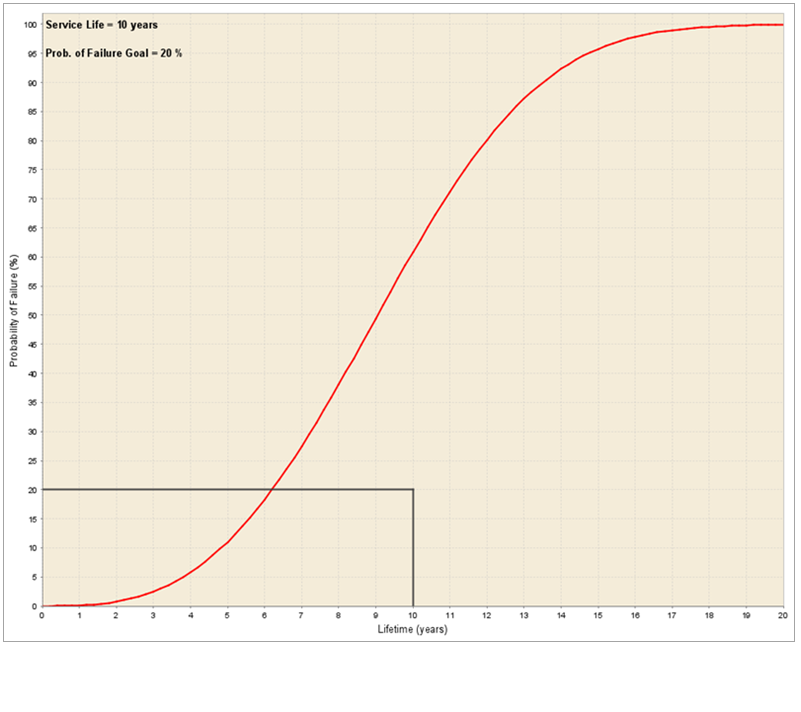
Click the Life Prediction tab to see a graph of the the part's Lifetime in years and its Probability of Failure.
Click the Time to Fail tab to see a bar graph of the analysis.