


To display the contours of static pressure, click the Contour
button ( ). In the Insert Contour dialog box that
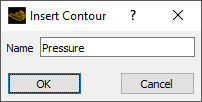
opens (Figure 3.32: The Insert Contour Dialog Box), enter
). In the Insert Contour dialog box that
opens (Figure 3.32: The Insert Contour Dialog Box), enter
Pressure for Name and click
.
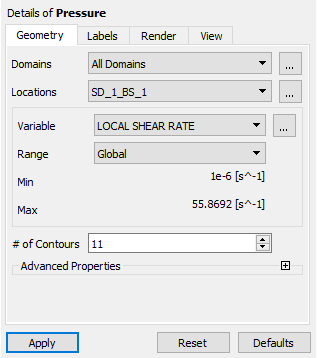
In the Geometry tab of the Details of
Pressure window (Figure 3.33: Selecting Domains),
click the Location editor button ( ) to the right of the Locations drop-down
list.
) to the right of the Locations drop-down
list.
Select SD_1_surf and SD_2_surf in the Location Selector dialog box (Figure 3.34: The Location Selector Dialog Box) and click .

In the Geometry tab of the Details of
Pressure window, click the More Variables button ( ) to the right of the Variable drop-down
list. Then select PRESSURE in the Variable
Selector dialog box (Figure 3.35: The Variable Selector Dialog Box) and click .

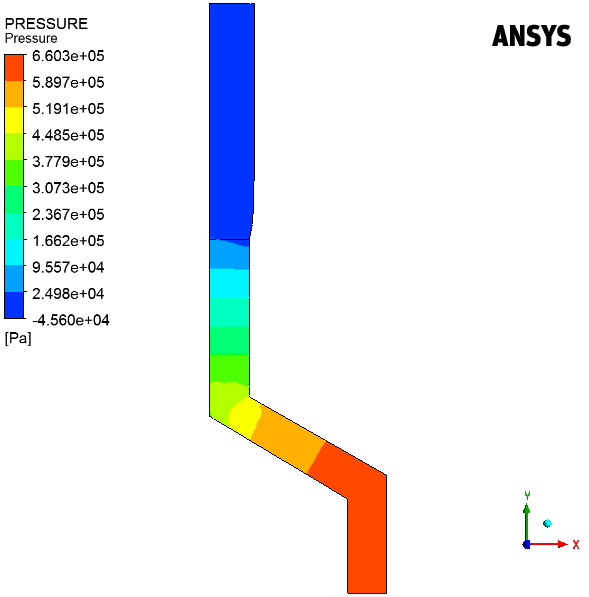
Click the Apply button in the Details of Pressure window to display the pressure contours in the graphic display window (Figure 3.36: Pressure Contours).
Double-click the Default Transform node in the
Outline tab (Figure 3.37: Mirroring a Domain). Then, in the
Definition tab of the Details of Default
Transform window, disable the Instancing Info From
Domain option, enter 2 for Number
of Graphical Instances, and make sure that the Apply
Rotation option is enabled. Next, make sure that Principal
Axis is selected from the Method drop-down list
and select Y from the Axis drop-down list.
Finally, select Value from the Determine Angle
From, and enter 180 for
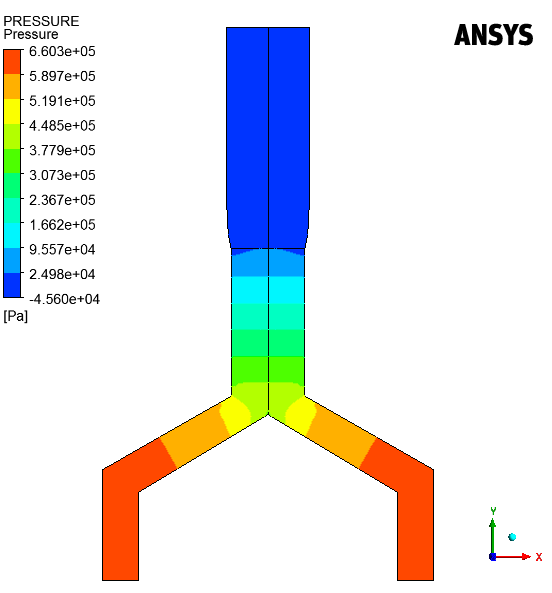
Angle. Click Apply and the
Fit View button ( ) in the graphics toolbar to display the contours with rotation
(Figure 3.38: Pressure Contours with Rotation).
) in the graphics toolbar to display the contours with rotation
(Figure 3.38: Pressure Contours with Rotation).

To annotate the display, select the Text option from the Insert menu.
Insert → Text
Click in the Insert Text dialog box that opens.
In the Definition tab of the Details of Text
1 window, enter PRESSURE contours for
Text String. Then click Apply.
