


Go to a section topic:
Create and Define the Nonlinear Adaptive Region
Specify the Number of Load Steps under Analysis Settings > Step Controls.
Insert a Nonlinear Adaptive Region object using the Conditions menu on the Environment Context tab. See the Property Descriptions section for a listing of all properties and their options.
Set the Store Results At property to in the Output Controls category of the Analysis Settings. This is a requirement of the feature.
Specify the scoping of the object. You can scope multiple Nonlinear Adaptive Region objects to the same entity to give yourself more control on multiple load step settings that are local to the Nonlinear Adaptive Region condition.
Specify the Criterion property: options include , , and . Following your selection, properly specify the associated properties. Review the Nonlinear Mesh Adaptivity Criteria section in the Mechanical APDL Nonlinear Adaptivity Analysis Guide and the NLADAPTIVE command description for specific command execution information regarding the Criteria and its options.
The properties in the newly available Analysis Settings category, Nonlinear Adaptivity Remeshing Controls.
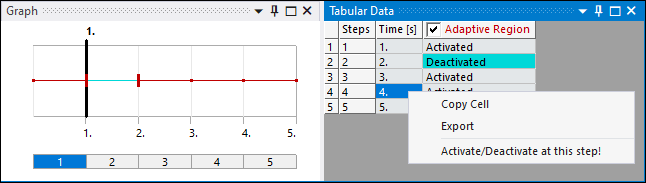
When the Nonlinear Adaptive Region is defined the Graph and Tabular Data windows provide a right-mouse click option to activate/deactivate a desired load step. No remeshing occurs at deactivated load steps (NLADAPTIVE command is set to OFF. For a restart analysis, the application sets the newly added Nonlinear Adaptive Region to Deactivated. For a review of the Activation/Deactivation of Loads, see the Step Controls section.
Complete the definition of the analysis and solve.
Following solution, you can view the changed mesh.
View Changed Mesh Results
Once the solution process is complete, you can determine if the mesh changed using one of the following methods:
Select the Solution object or a Result object. The Tabular Data window displays the substeps with a changed mesh (Changed Mesh column = ).
Select the Solution Information object and set the Solution Output property to . A chart displays. Remesh Points are shown as solid orange vertical lines.
Create a User Defined Result (using the PNUMELEM Expression) to view the new elements that have relatively larger element identities than the original element identities. You can duplicate this result and specify a ( property) for a result prior to a remesh and one at a remesh point, and using the Viewports feature, directly compare the (before and after) elements in the graphics window.