As shown in the figures below, properties such as Name, Enable, Symmetric and so on can be defined in the Spline3D sub-entity window. General Sub-Entity Properties have been introduced in Figure 8.18: General properties of sub-entity pages and toolbar and the special properties are shown in the table below.
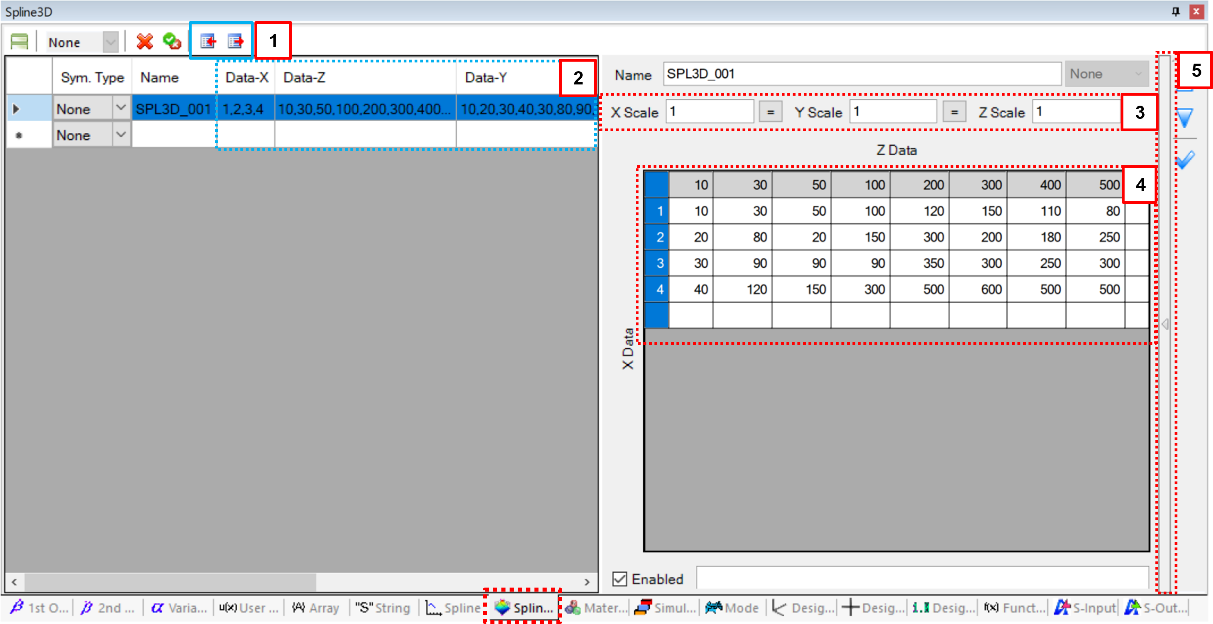
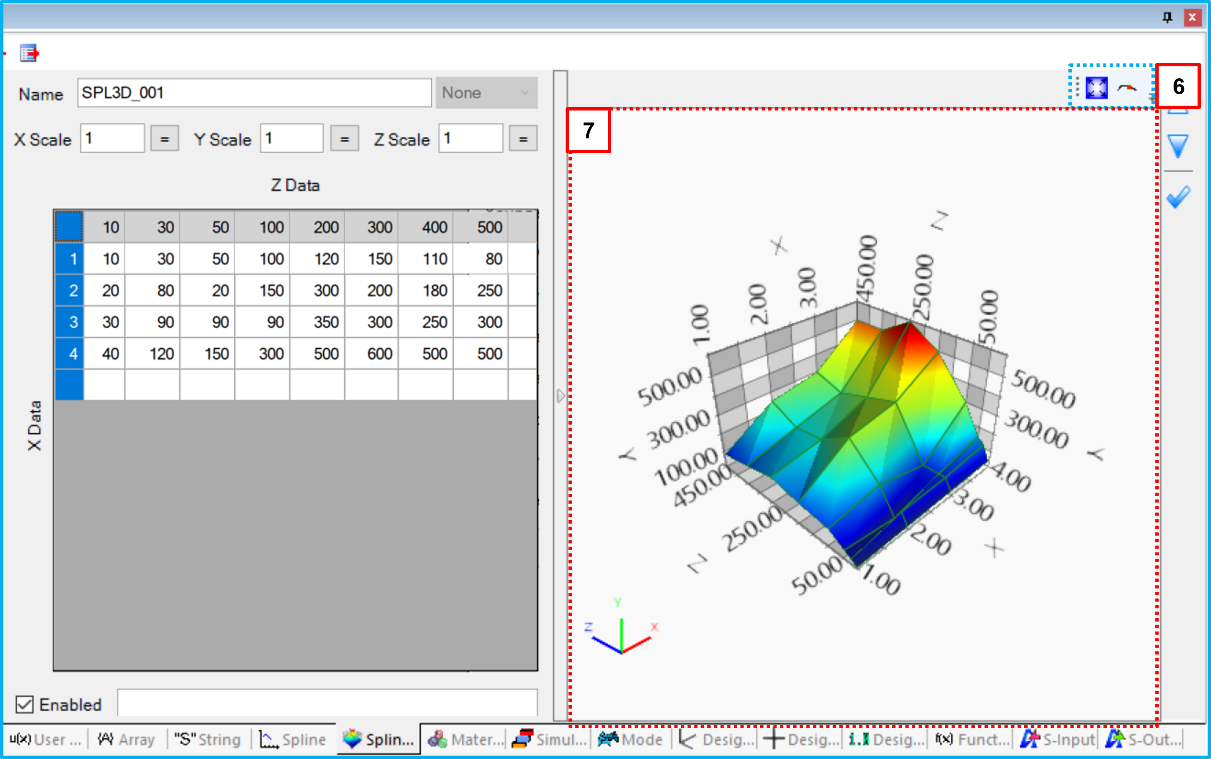
Figure 8.71: Spline3D properties
| Parameter | Symbol | Description | Dimension (Range) |
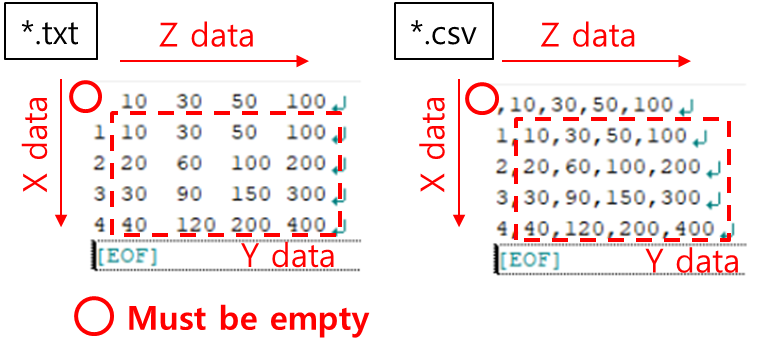
| 1. File Data | N/A | Use to import and export a file which contains x, y, z data for Spline3D. The file has a text format, as shown in Figure 8.72: File format for Spline3D data. The values are distinguished by the space, comma and tab. The imported contents are shown in the grid view. | N/A |
| 2. Data | N/A |
Use to show x, y, z values of the spline. Input x data in the first column, z in the first row, and data for y from the 2nd row and 2nd column. No data is entered in the 1st row and 1st column. | N/A |
| 3. Scale | N/A |
Use to set the scale factors for the x, y, z data. The values of x, y, z for can be determined as follows.
where |
N/A (Real) |
| 4. Data Grid Window |

| Use to set the values of the x, y, z data. The number of x and z data values must be greater than four. The x and z data must be sorted in ascending order. The x and z data are independent variables and y data is the corresponding variable for x and z. The y data field must not be empty. This data can be imported from and exported to a specified file using the File Data field (above). |
N/A (Real) |
| 5. Access button | N/A | Use to open or close the graph window. | N/A |
| 6. View Tools | N/A | Use to control the view in the graph window. The  button is used to fit the
graph in the chart window. The button is used to fit the
graph in the chart window. The  button is used to show the
data point on the curve. button is used to show the
data point on the curve. | N/A |
| 7. Graph Window | N/A | Use to plot a graph of the Spline3D data. This window supports several tools to create the Spline3D and view the graph. | N/A |