As shown in the figures below, properties such as Name, Enable, Symmetric and so on can be defined in the Spline sub-entity window. General Sub-Entity Properties have been introduced in Figure 8.18: General properties of sub-entity pages and toolbar and the special properties are defined in the table below.
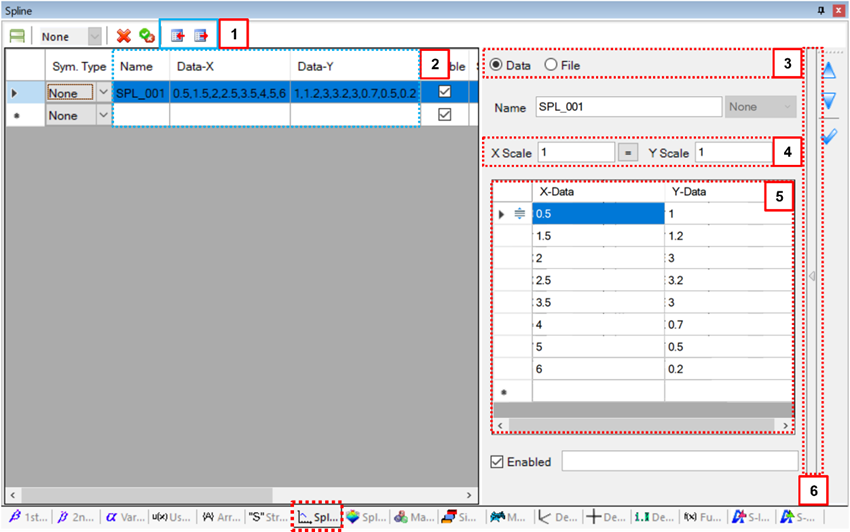
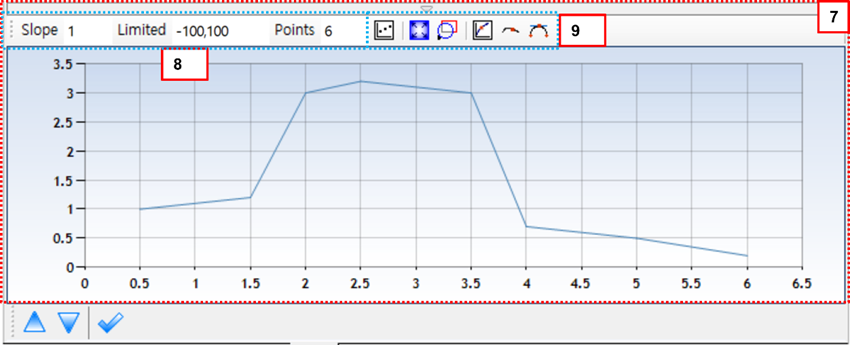
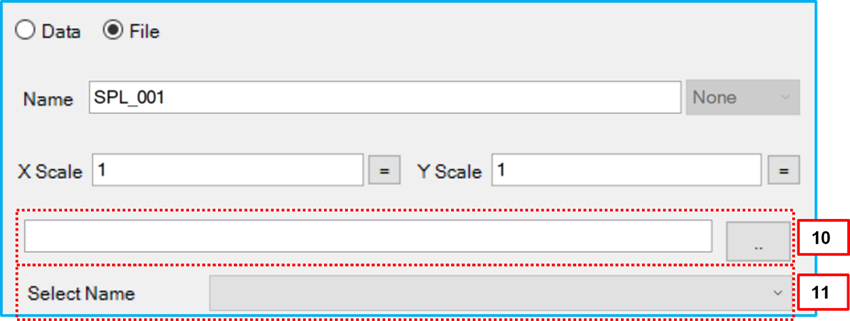
Figure 8.65: Spline properties
| Parameter | Symbol | Description | Dimension (Range) |
| 1. File Data | N/A | Use to import and export a file which contains x and y data for a spline. The file has text format (space, comma, tab) when one line is selected, and xml format when multiple lines are selected. | N/A |
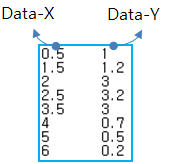
| 2. Data | N/A | Use to show x and y-values of the spline. | N/A |
| 3. Type | N/A | Use to select a data type for the spline. When Data is selected, the x and y-values can be entered in the data grid window. When File is selected, the x and y-values can be set from the Motion spline data file as shown in Figure 8.64: File options in the Spline sub-entity window. For this type, see the contents of fields 10 and 11. | N/A |
| 4. Scale | N/A |
Use to set the scale factors for the x and y data. The values of x and y for can be determined as follows.
where |
N/A (Real) |
| 5. Data Grid Window |  , , | Use to set the values of the x and y data. The number of data values must be greater than three. The x data must be sorted in ascending order. The x data is an independent variable and y data is the corresponding variable for the x-axis. This data can be imported from and exported to a specified file (see field 1). |
N/A (Real) |
| 6. Access button | N/A | Use to open or close the graph window as shown in Figure 8.62: Spline sub-entity window. | N/A |
| 7. Graph Window | N/A | Use to plot a graph of the spline data or create a simple spline data. This window supports several tools to create the spline and view the graph as the contents 10 and 11. | N/A |
| 8. Creation Tools | N/A | Use to create a linear spline. Slope is used to set
the slope of the line. Limited determines
the minimum and maximum values for the independent variable.
Points sets the number of data points. When
the  button
is clicked, the linear spline is drawn from the related
parameters. button
is clicked, the linear spline is drawn from the related
parameters. |
N/A (Real and Integer) |
| 9. View Tools | N/A | Use to control the view of the graph window. The  button is used to fit the
graph in the chart window. The button is used to fit the
graph in the chart window. The  button is used to zoom the
selected area of the graph. The button is used to zoom the
selected area of the graph. The  button is used to modify
the y data by dragging. The button is used to modify
the y data by dragging. The  button is used to show the
data point on the curve. The button is used to show the
data point on the curve. The  button is used to show the
original curve when the curve is modified. button is used to show the
original curve when the curve is modified. | N/A |
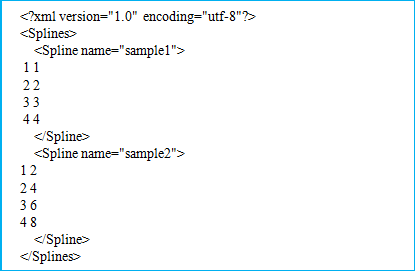
| 10. Spline File | N/A | Use to set the Motion Spline file which is an XML type as shown in the figures below. The file can contain multiple splines. Note that when the spline data in the file is modified, the modified data is applied in Motion solver. | N/A |
| 11. Select Name | N/A | Use to select one of splines in the DFSPL file. | N/A |