


You can interpolate graphs with the desired number of data points in the chart view. At least one graph must be selected for the operation as in the following steps.
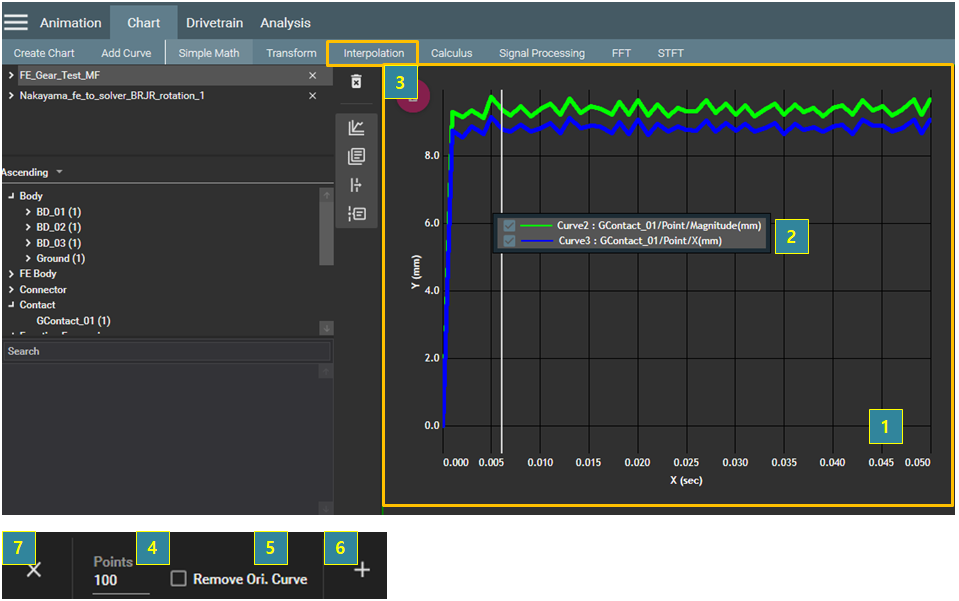
Figure 4.27: Steps for Interpolation
| Step | Description |
| 1 | Select the chart view. |
| 2 | Select the target graphs for the operation. |
| 3 | Select from the menu bar. |
| 4 | Set the number of data Points for the interpolated curve. |
| 5 | Select Remove Ori. Curve if you want to remove the target graphs. |
| 6 | Click the  button to create the graph. button to create the graph. |
| 7 | Click the  button to close the operation. button to close the operation. |