


You can transform graphs through translate, align, scale, and absolute in the chart view. At least one graph must be selected for the operation as in the following steps.
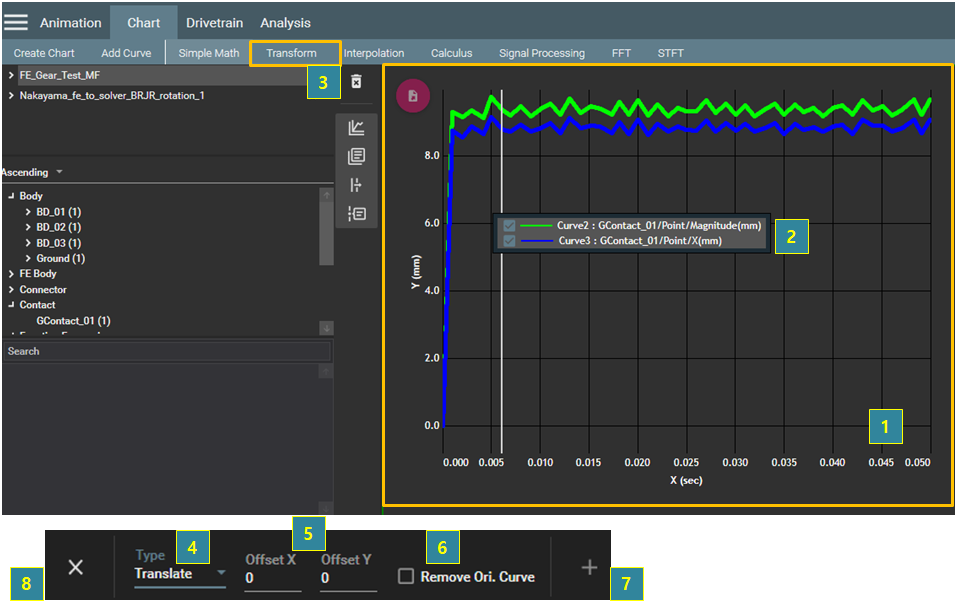
Figure 4.24: Steps for the Transform operation
| Step | Description |
| 1 | Select the chart view. |
| 2 | Select target graphs for the operation. |
| 3 | Select from the menu bar. |
| 4 |
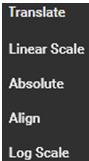
Select the Type from the following options: , ,, , and .
|
| 5 | Set the parameters for the operation. |
| 6 | Select Remove Ori. Curve if you want to remove the target graphs. |
| 7 | Click the  button to create the graph. button to create the graph. |
| 8 | Click the  button to close the operation. button to close the operation. |
Figure 4.25: Parameters for Transform
| Transform | Parameter | Description |
| Translate | Offset X | Used to set the offset value for the x-axis data. |
| Offset Y | Used to set the offset value for the y-axis data. | |
| Linear Scale | Scale X | Used to set the scale value for the x-axis data. |
| Scale Y | Used to set the scale value for the y-axis data. | |
| Log Scale | Coefficient | Used to set the coefficient of the log scale. |
| Base | Used to set the base of the log scale. | |
| Absolute | Sign | Used to set the sign of the resultant curve. |
| Align | Align | Used to set the type for alignment. When set to , the selected graph is translated with an offset which is determined as the difference between zero and first data of the graph. When is selected, the offset is determined as the difference between the first datum of the target graphs and reference graph (final selected graph). |