


VM-LSDYNA-SOLVE-034
VM-LSDYNA-SOLVE-034
Evolution of the Solder Ball Shape Using 1521 Particles
Overview
| Reference: | Lin, H.C., Kung, C., Chen, R.S. (2007). Evaluations of the BGA solder ball shape by using energy method. Computers, Materials & Continua, 6(1), 43-50. https://doi.org/10.3970/cmc.2007.006.043 |
| Analysis Type(s): | ISPG |
| Element Type(s): | 1521 Particle |
| Input Files: | Link to Input Files Download Page |
Test Case
In this test case, the LS-DYNA application simulates the solder standoff height of a solder ball using 1521 particles by reproducing the evolution and final shape of the solder. Results are compared to the reference. Figure 122 and Table 3 show the configuration details.
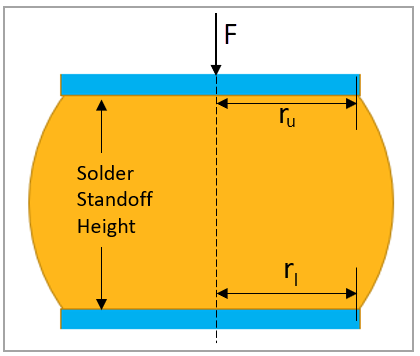
where
| ru is the radius of the upper solder pad. |
| rl is the radius of the lower solder pad. |
| V is the solder volume. |
| T is the surface tension. |
| F is the external force. |
For material properties used in the simulation, see Table 4. The upper plate utilizes an elastic material while the lower plate is made of a rigid material. An IFPD material is used for the solder ball. This material is specifically designed for modeling fluid particles in incompressible free surface flow using incompressible SPG (smoothed particle Galerkin) methods.
Table 4: Material Properties
| Elastic material for upper plate and rigid material for lower plate | |
|
Mass density = 10-5 kg/mm3 Young's module = 69 GPa Poisson ratio = 0.3 | |
| IFPD material | |
|
Fluid density = 9.28 x 10⁻⁶ kg/mm3 Dynamic viscosity = 2 x 10⁻⁶ GPa/ms |
Analysis Assumptions and Modeling Notes
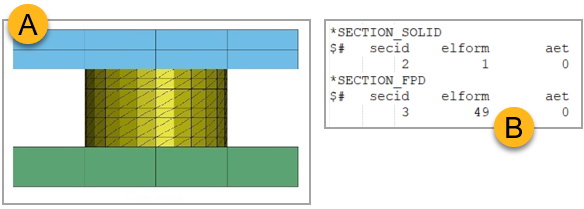
See Figure 123 below. The mesh for the upper and lower plates is created using a solid mesh defined by the *SECTION_SOLID card, with ELFORM (Element Formulation) set to 1 to indicate a constant stress solid element. In contrast, the solder ball is meshed using an ISPG (incompressible smoothed particle Galerkin) element defined by the *SECTION_FPD card, with ELFORM set to 49.
The CONTROL_TERMINATION card is used to set the simulation time with ENDTIM. Simulation time is 20 ms.
Results Comparison
Figure 124 shows the evolution of the solder standoff height with respect to the simulation time.

As shown in the table below, the simulation result closely corresponds to reference target.
| Results | Target | LS-DYNA Solver | Error (%) |
|---|---|---|---|
| Solder Standoff Height (mm) | 0.0848 | 0.0852 | 0.47 |