The following sections of this chapter are:
The injection of ice crystals at high altitudes has been identified as the cause of numerous aircraft engine power loss events. Normally it is believed that fully glaciated ice particles do not create ice accretion because they bounce off cold external surfaces of airframe such as wing and tail. When entering into the engine core, however, glaciated ice particles encounter air with increasing warm temperature and start to melt. Melting promotes particle sticking on impacting substrate, which cause surface temperature to cool down gradually. When sub-freezing temperature is reached, ice starts to accrete and grow. The ice formation changes the aerodynamic shape of blades and cause a change in flow patterns and compressor aerodynamics. Sustained ice accretion can cause compressor stall, surge, or un-commanded engine rollback. If accreted, ice can shed under centrifugal force and/or slush ice can move over the surfaces. This may cause blade damage, abrupt excessive vibrations, or engine flameout.
The characteristics of ice formation inside the engine core are different than the conventional glaze or rime ice that are formed under cold external airflow. Experiments showed that ice can accumulate on engine walls as slushy ice-water mixtures. Ice can then be considered as porous with liquid water in its empty volume. The scope of the classical glaze-ice model in ICE3D does not cover this type of ice formation which is experienced inside the engine core. Therefore, a new model is developed and introduced to improve this type of icing application. The main purpose of the ice crystal icing model (ICI) is to determine icing risk in engine compressors. Risk assessment does not require the calculation of exact accretion mass and shape as in external aero-icing applications. Risk assessment can be defined as the determination of stable, sustained positive ice accretion rate on any relevant wall surface of a compressor flow path.
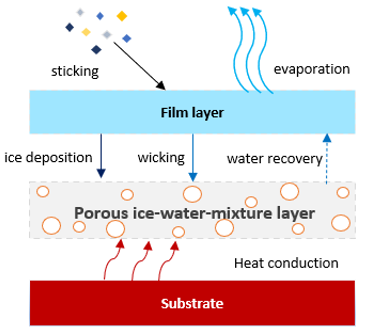
The new ICI model is based on a three-layer concept, as shown in the figure below. At the bottom, the substrate conduction layer represents a thin metal plate that serves to transfer heat from an internal reservoir to the ice layer. In the current version, it is assumed that the internal reservoir is maintained at a constant temperature and provides sustained heat transfer to the ice layer. The substrate thickness and material conductivity are required to compute the conductive heat flux. The porous ice-water-mixture layer in the middle has a varying thickness which depends on accretion. The porous nature enables it to hold a certain amount of liquid water. In reality, the ice-water-mixture may turn into moving slush along warm substrate walls. Above all layers, the thin film layer receives particle impingement and solves runback water movement. Mass and energy balance calculations determine the ice accretion rate. In particular, water wicking and recovery are special mechanisms in the ICI model to transfer liquid water between the film layer and the porous ice layer. It is assumed that water can be absorbed into the ice layer when it is not fully saturated at a constant rate provided by the user. Reversely, water can be recovered from the ice layer to the film layer if the later dries.
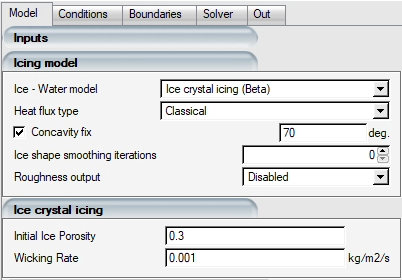
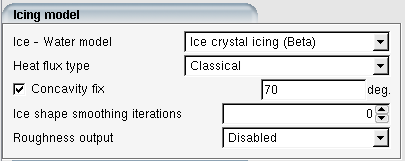
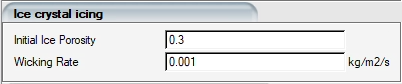
The new icing model can be enabled by selecting Ice crystal icing (Beta) from the Icing model list. You are required to provide the Initial Ice Porosity and Wicking Rate. The default ice porosity is 30% and the wicking rate is 1 g/m2/s.
The internal heat reservoir can melt ice through conduction. To some extent, the meltwater may be fully absorbed by the porous ice sheet at the given wicking rate. When heating power is too high, the generation rate of meltwater can be too large to allow prompt absorption by the ice sheet within a given period of time. As a result, residual meltwater can exist under the ice sheet. This can lead to adhesion loss and trigger ice shedding. Similarly, if the ice sheet is fully saturated, meltwater wicking is not possible regardless of the heating power level. In this case, ice shedding can happen as well. The ice adhesion loss mechanism does not consider the cohesive bond. This adhesion loss behavior is embedded in this model by default, without the need of an ice shedding model.
This section demonstrates the use of the ice crystal icing model on an engine icing simulation. This tutorial should be conducted after Complete Reinjection Mode.
Create a new DROP3D-TURBO run by clicking the New run icon and name it
CRYSTAL-COMPLETE-REINJECTION-ICI. Set the Number of rows to6.Drag and drop the config icon of the previous CRYSTAL-COMPLETE-REINJECTION run, configured in Complete Reinjection Mode, to the config icon of this run. This operation copies previous settings and Reference conditions onto this run.
Double-click the config icon to open the DROP3D-TURBO input parameters window and go to the Model panel.
In the Icing model section, set the Ice -Water model to .
In the Ice crystal icing section, keep the default setting for Initial Ice Porosity and Wicking Rate.
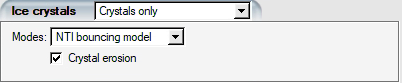
The Ice crystals settings should automatically be copied from the complete reinjection run. Verify that is selected and is enabled.
Go to the Boundaries panel. The icing and heat conduction boundary conditions can be set on each wall. By default, the substrate heat conduction is disabled given zero wall thickness or zero thermal conductivity of the solid material. To enable it, you need to provide a valid wall thickness, thermal conductivity, and the internal reservoir temperature. In this tutorial, it is assumed that the internal reservoir temperature increases gradually towards the engine core. In particular, the reservoir temperature for IGV, rotor and stator are 273.65 K, 274.15 K and 274.65 K, respectively. The reservoir temperature is set above the freezing temperature such that a positive heat conduction can flow from metal wall to the icing surface. The wall thickness is assumed constant at 5 mm. The thermal conductivity of the substrate material is set to 12 W/mK. Check to see that the walls for each row are as follows:
Row BC Label Icing Wall thickness (m) Thermal conductivity (W/mK) Internal reservoir temperature (K) 1 2000 Enabled Sliding 0 0 273.15K 2001 Disabled Sliding 2002 Enabled 2 2003 Enabled 0.005 12 273.65 2004 Enabled Sliding 2005 Enabled Sliding 3 2006 Enabled 0.005 12 274.15 2007 Enabled Sliding 2008 Enabled 4 2009 Enabled Sliding 0 0 273.15 2010 Disabled 2011 Enabled 2012 Enabled 5 2013 Enabled 0 0 273.15 2014 Enabled 6 2015 Enabled 0.005 12 274.65 2016 Enabled-Sliding 2017 Enabled-Sliding Go to the Solver panel. Deselect and set the Time step to
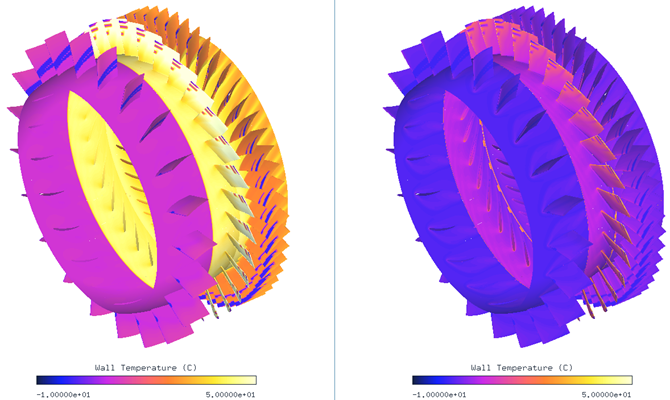
1e-4. Set the Total time of ice accretion to5seconds. Go to the Out panel and set the Time between solution output to5seconds. Launch the run with a proper Number of CPUs.The results of the ICI model are compared to the classic glaze ice model. The icing wall temperature shows a clear difference. The glaze model assumes adiabatic walls so that no energy exchange can happen between the film layer and its underlying substrate walls. Therefore, at dry regions the surface temperature is equal to the adiabatic wall temperature. For the ICI model, however, heat conduction plays an important role. For the IGV row, for example, the internal reservoir temperature is set to a constant value of 0.5 Celsius degree. Heat transfer direction is then determined by the surface temperature. At ice-water mixture regions where zero degree is reached, a positive conductive heat flux will be applied. At dry regions where adiabatic wall temperature is warmer than freezing, a negative conduction will take place. This takes away heat and lower the surface temperature, which is in direct opposition to convective heat flux. In the end, a heat balance is reached until surface temperature resides between the adiabatic wall temperature and the internal reservoir temperature.
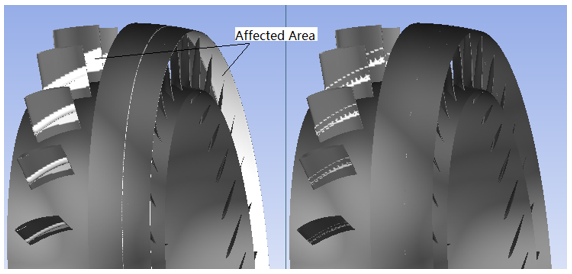
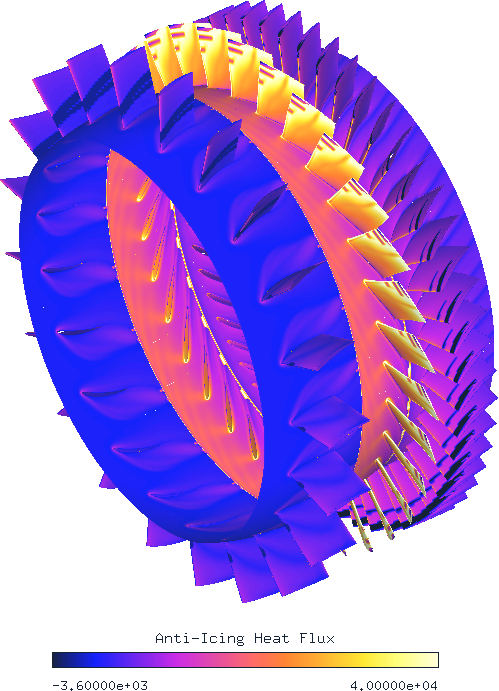
The anti-icing heat flux applied in the ICI model, as shown below, confirms the heat flow direction mentioned in the previous section. The anti-icing heat flux is zero for the glaze model, therefore it is not shown. A positive anti-icing heat flux represents heat loss to the icing surface, while a negative value indicates a heat supply. The rotor row shows the higher anti-icing heat flux magnitude compared to the IGV and the stator rows, which suggest a larger difference between the local adiabatic temperature and the prescribed reservoir temperature. On icing areas where a dark color is seen, a positive heat supply is applied.
In the Ice crystal icing model, the adhesion breakdown of ice to the substrate surface can be triggered in two ways. First, when a strong conduction heat is applied, the meltwater generation rate in a short period of time can be higher than the possible water wicking capability of the ice sheet. This can leave a residual meltwater that reduces the ice bonding to the surface and eventually can lead to complete adhesion loss. Second, ice can become fully saturated even with a weaker heat conduction as long as the application time is long enough. When that happens, no more meltwater can be further absorbed by the ice sheet. As a result, similar debonding effect can be assumed due to water residual underneath the ice.
The main ice accretion regions in this tutorial include the IGV blade and the shroud wall of the rotor row. The internal reservoir temperature for IGV and rotor rows are set to 0.5 and 1 Celsius degree, respectively. With a metal thickness of 5 mm and thermal conductivity of 12 W/mK, the generated positive heat conduction is capable of creating a higher meltwater rate than the defined wicking rate at 1 g/m2/s. This triggers ice adhesion loss and shedding as described above. The ice shape predicted by the ICI model describes the end result at each time step including ice buildup and shedding. The determination of shedding frequency is not the main purpose of this model. Rather, the ICI model is intended to use as a risk assessment tool to predict if an engine is facing a risk from sustained ice growth or harmless build-and-shed cycle. Apparently, the latter can be inferred from the current calculation.