


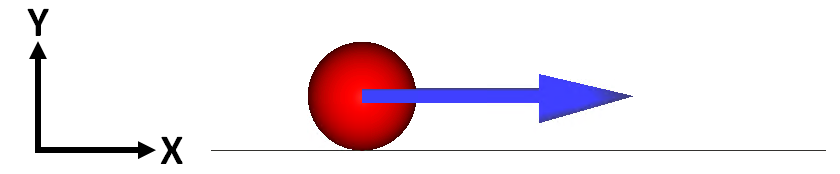
In this verification case, a spherical particle acting under gravity and with the following criteria begins to roll on a flat surface:
Diameter

Initial translational velocity in the x-direction

Initial rotational velocity in the z-direction

Due to the rolling friction, the translational velocity is converted into rotational velocity. After a short deceleration phase, the no-slip condition occurs at the ball-surface contact point and the ball reaches constant translational and rotational velocities. An illustration of this case at initial time condition is shown in Figure 2.1: Ball rolling on a flat surface..
From the relation between the kinetic friction force acting on the particle, the translational and rotational velocities of the particle rolling in the x-direction may be expressed as follows:
(2–1) |
 | (2–2) |
where:
 is the particle's position in the horizontal direction.
  is the particle's translational velocity in the horizontal direction.
 is the particle's rotational velocity.
  is the gravity acceleration in the vertical direction.
  is the dynamic friction coefficient between the particle and the
surface materials.
is the dynamic friction coefficient between the particle and the
surface materials.  is the particle's mass.
  is the particle's diameter.
  is the particle's moment of inertia.
By integrating equations Equation 2–1 and Equation 2–2 with the initial conditions  and
and  , the time
  when the rolling friction stops and
  equals
  , can be given by:
 | (2–3) |
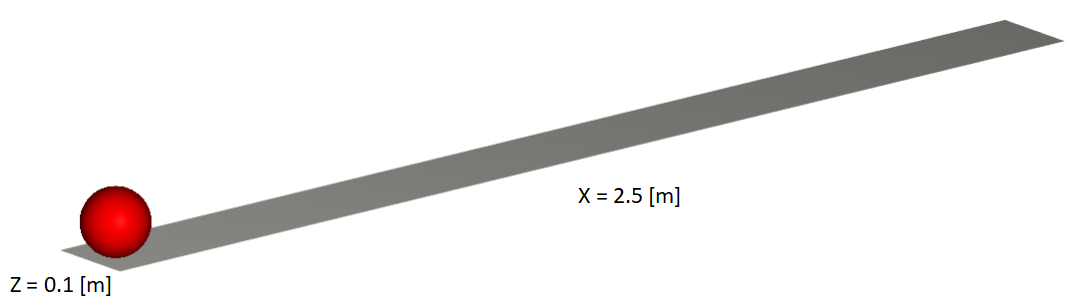
The equations shown in the last section can be resolved and equivalent results can be calculated by Rocky considering the same input data and boundary conditions. The input parameters for this verification case setup are presented in Table 2.1: Verification case input parameters. and the geometry dimensions are shown in Figure 2.2: Flat surface geometry dimensions..
Table 2.1: Verification case input parameters.
|
Parameter |
Value |
Unit |
|---|---|---|
|
Physical Model: | ||
| Thermal | Disabled | - |
| Normal Force | Hysteretic Linear Spring | - |
| Tangential Force | Linear Spring Coulomb Limit | - |
| Adhesive Force | None | - |
| Rolling Resistance | None | - |
| Gravity Y | None |  |
|
Wall Geometry (Flat Surface): | ||
| Length (X) | 0.25 |  |
| Length (Y) | 0.0 |  |
| Length (Z) | 0.1 |  |
|
Solid Properties: | ||
| Particle Diameter | 0.1 |  |
| Particle Density | 10,000 |  |
| Particle-Geometry Dynamic Friction Coefficient | 0.2 | - |
| Particle Initial Translational Velocity | 3.0 |  |
| Particle Initial Rotational Velocity | 0.0 |  |
|
Solver Parameters: | ||
| Simulation Duration | 1.0 |  |
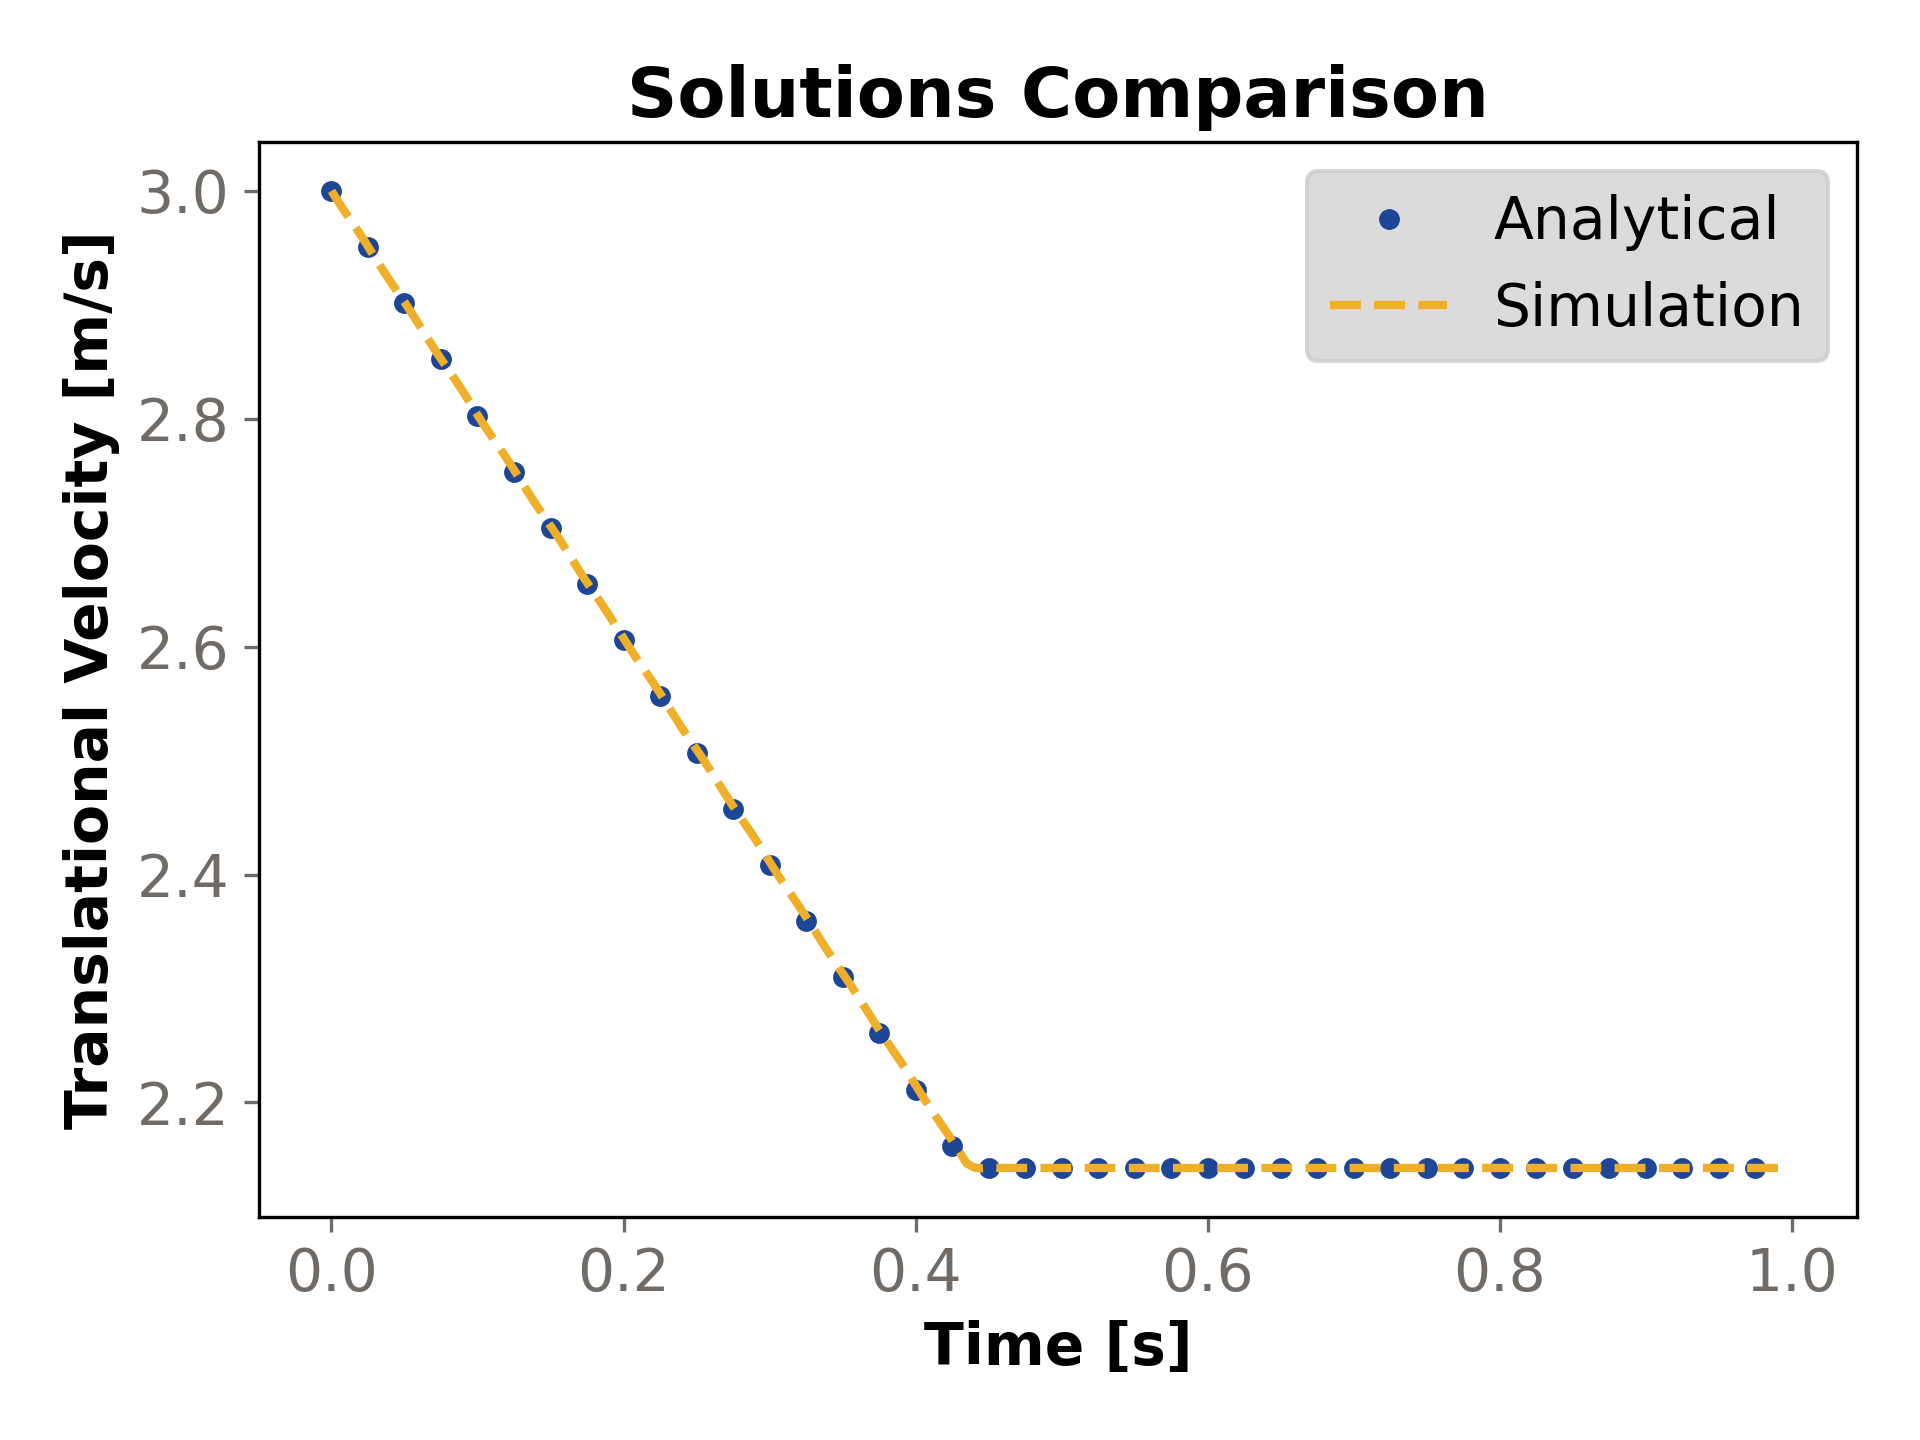
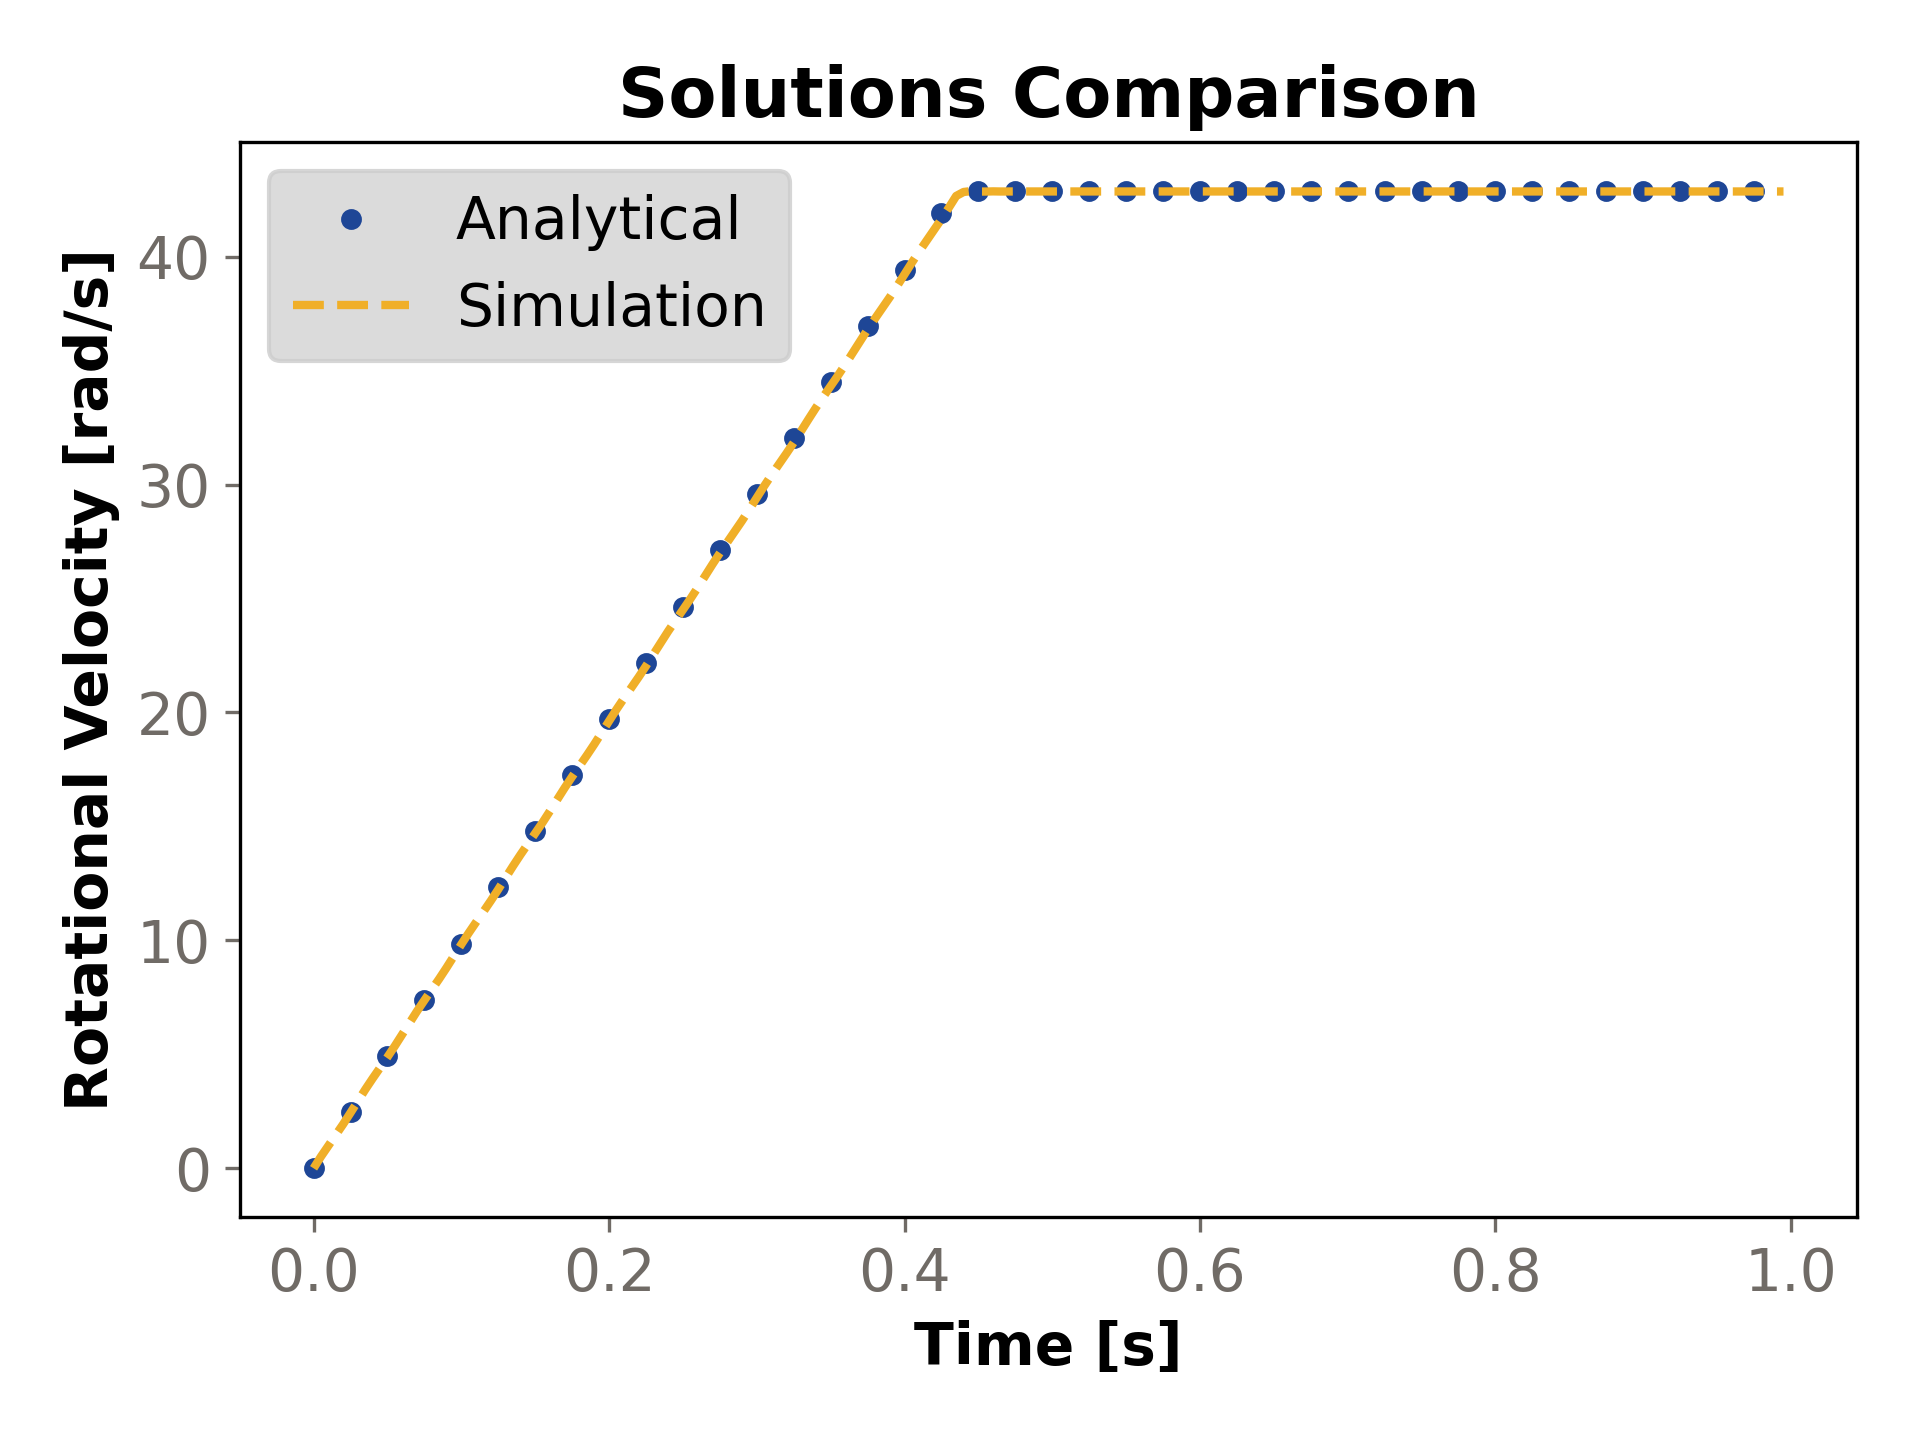
After running the Rocky case as specified, the results can then be compared to the analytical values. Here, the evolution of the translational and rotational velocities over time are shown in Figure 2.3: Comparison of the ball particle's translational velocity. and Figure 2.4: Comparison of the ball particle's rotational velocity., respectively. The numerical solution given by Rocky presents strongly correlated values to those obtained by the analytical expressions.
The absolute and relative errors for the particle velocities are compared in Figure 2.5: Translational velocity absolute and relative errors. and Figure 2.6: Rotational velocity absolute and relative errors.. The maximum absolute errors for the translational and rotational velocities are around 0.005 m/s and 0.25 rad/s, respectively. The maximum relative errors are around 0.23% and 4.5%, respectively.
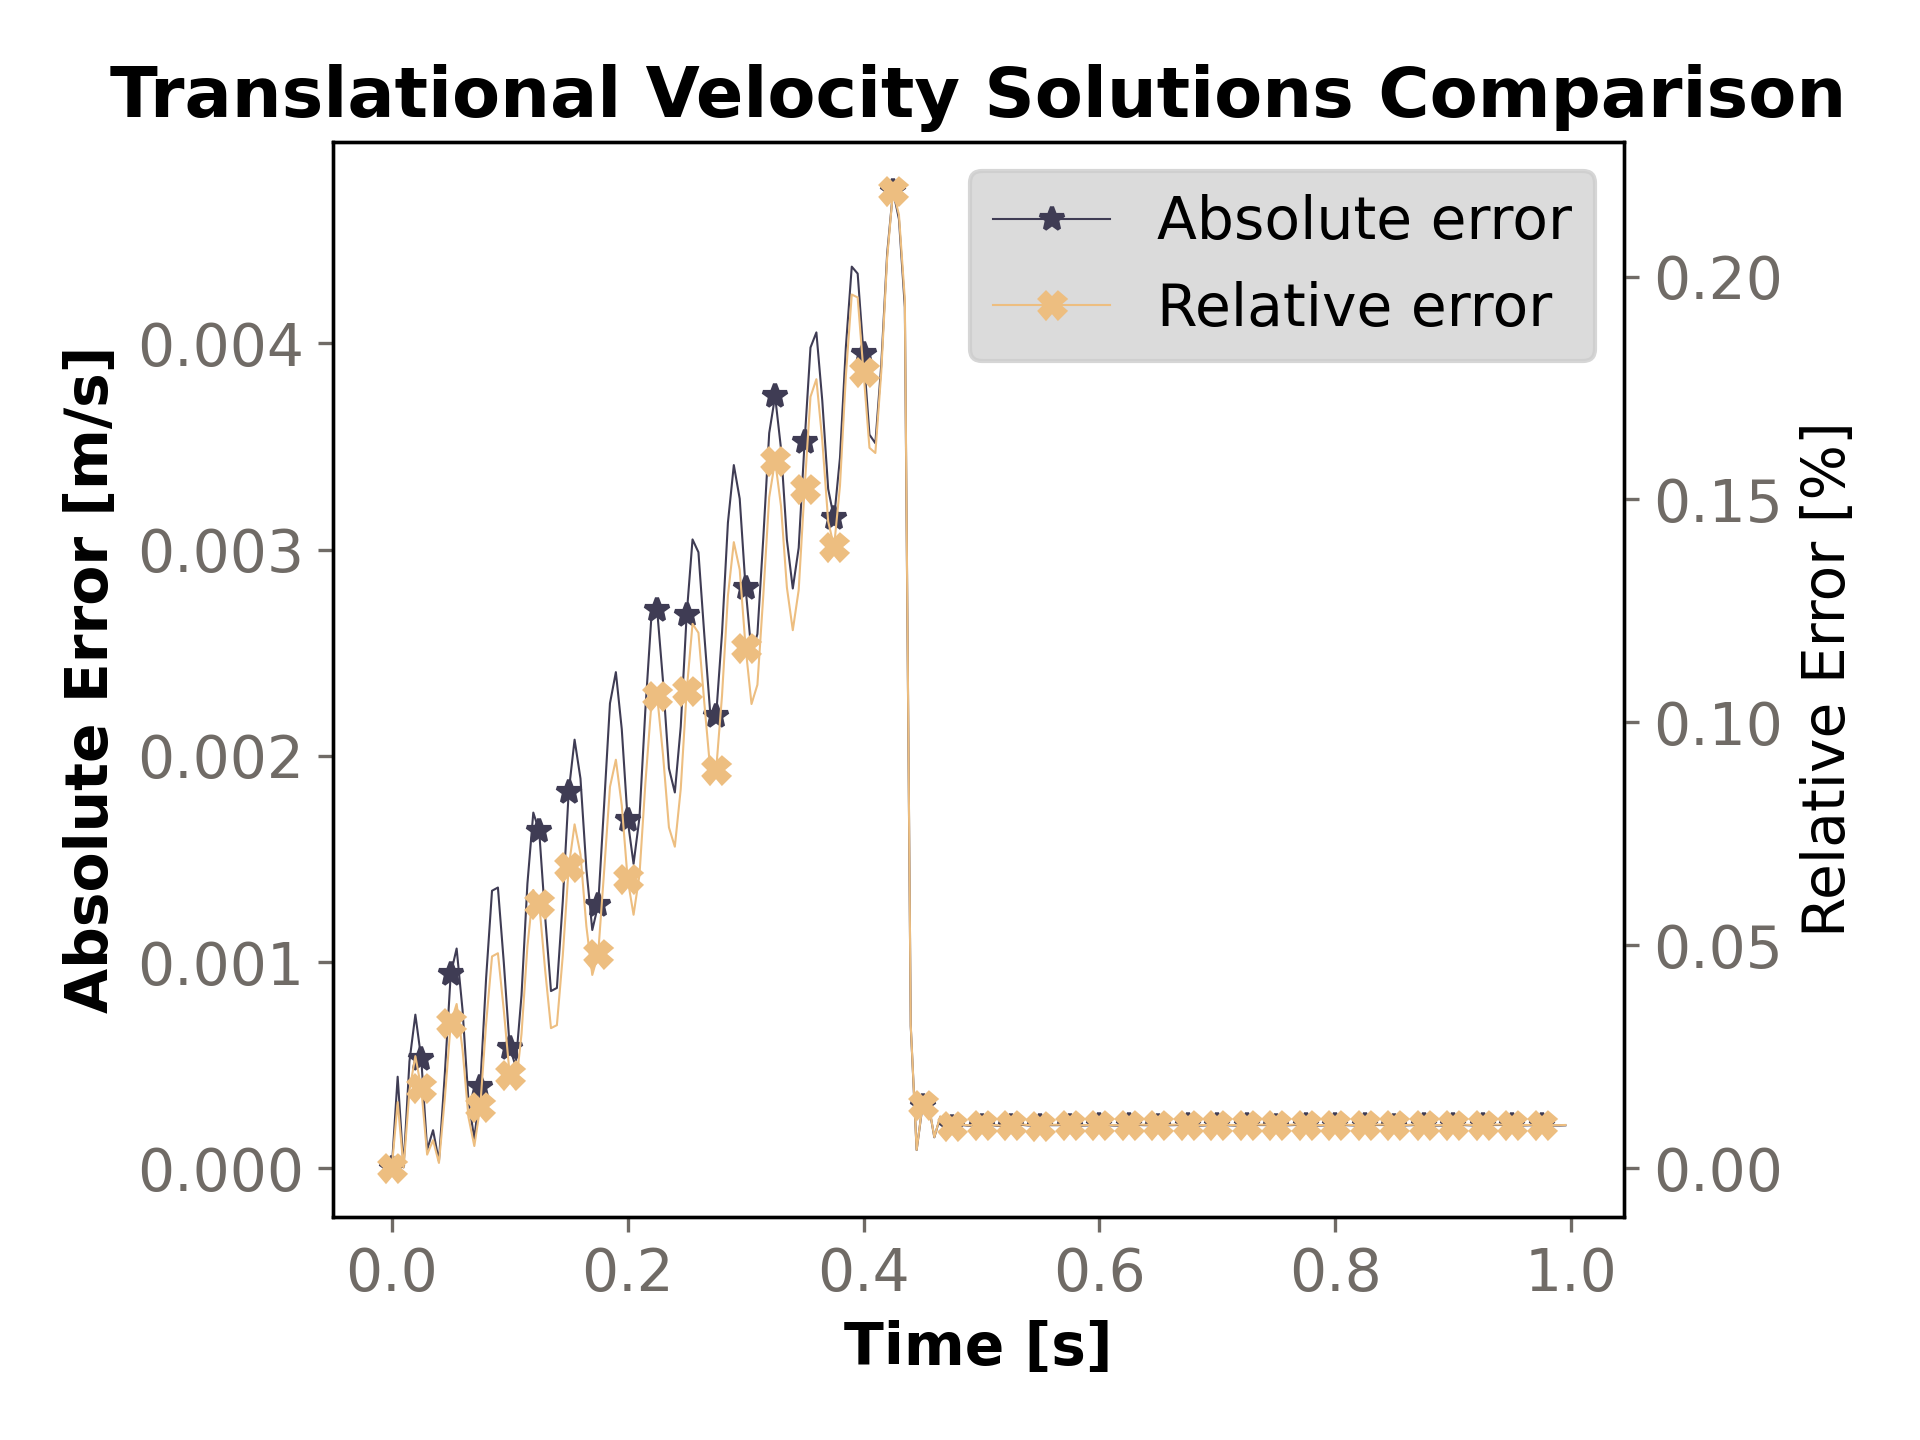
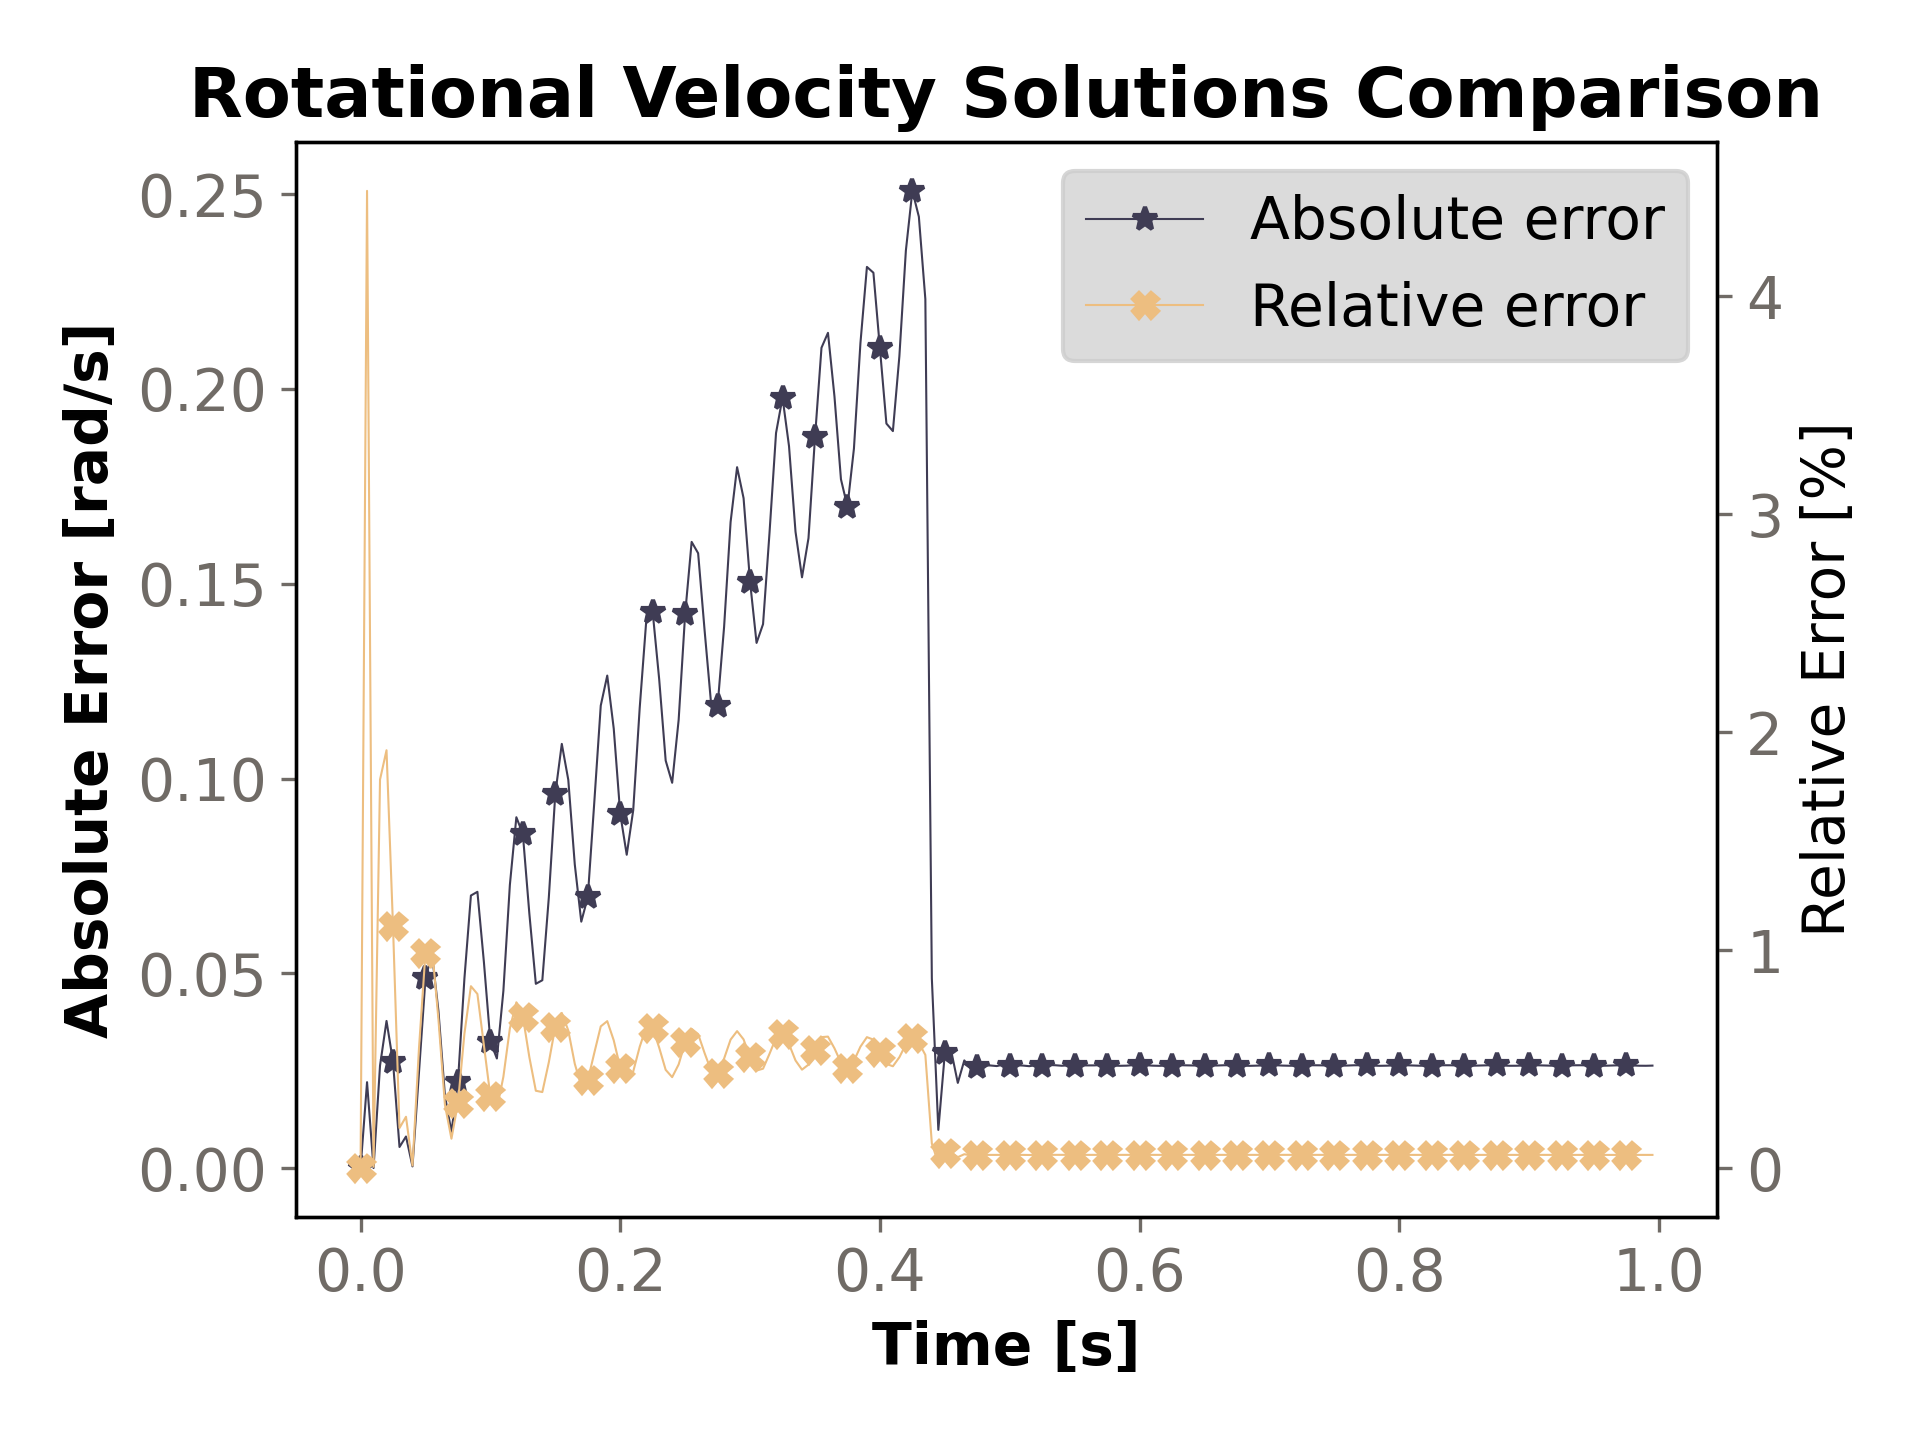
Table 2.2: Translational and rotational velocities targets lists the values for the final translational and rotational velocities. These include the target values calculated by the analytical expressions, the numerical results calculated by Rocky, and the ratio between both, which shows a strong correlation between results.
Table 2.2: Translational and rotational velocities targets
| Target | Rocky | Ratio[-] | |
|---|---|---|---|
| Translational Velocity [m/s] | 2.14224 | 2.14245 | 1.00009 |
| Rotational Velocity [rad/s] | 42.88794 | 42.86162 | 0.99939 |