The Mechanical application provides a multitude of postprocessing analyses. The following instructions will help you get started in examining the results.
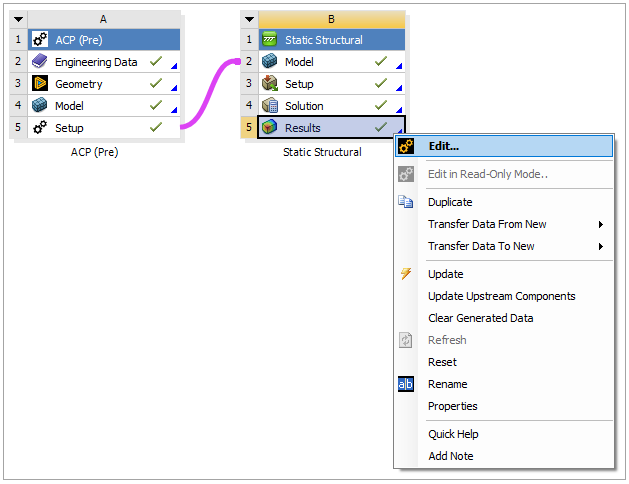
In the Ansys Workbench software, you can postprocessing results for composite materials directly in the Mechanical application by right-clicking Static Structural and selecting the Edit cell.
A deformation plot displays the panel's behavior for a specific solution. Both total and directional deformation plots are available in the Mechanical application. To create both deformation plots for the panel, follow these steps:
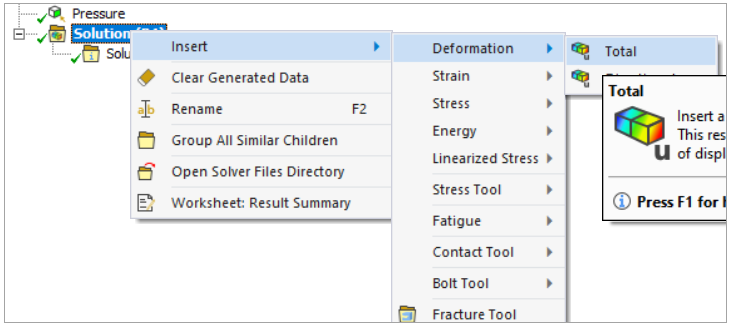
Total Deformation
In the Tree View, right-click the Solution group and select Insert > Deformation > Total.
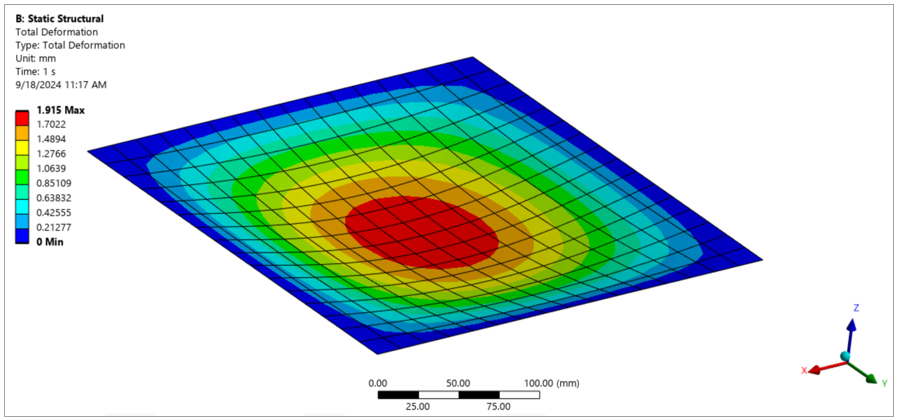
Right-click Total Deformation and select Retrieve This Result. The total deformation is shown in the following figure:
Directional Deformation
In the Tree View, right-click the Solution group and select Insert > Deformation > Directional. In the details panel, select the proper axis in the Orientation field.
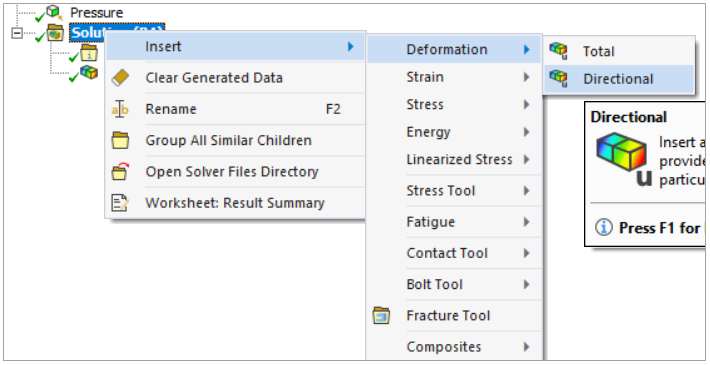
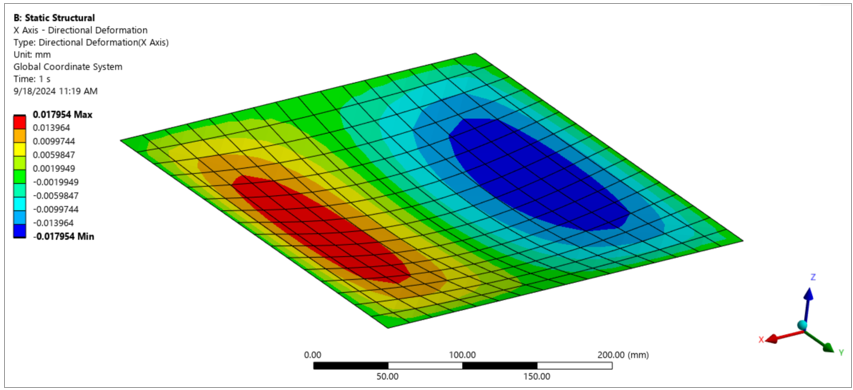
Right-click Directional Deformation and select Retrieve This Result. The directional deformation in the x-axis is shown in the following figure:
Failure criteria evaluate the strength of a composite structure. The Mechanical application provides a number of analyses to assess the strength assessment of a composite. It allows you to create failure definitions, then combine and configure them.
In this step, a combined Failure Criteria is configured to create an overall failure plot of the composite structure. The stress limits for your two materials were defined in the Engineering Data at the beginning of this tutorial. Before you begin, ensure that your material models contain the appropriate failure parameters.In the Mechanical application, the failure plot is available through the Composite Failure Tool:
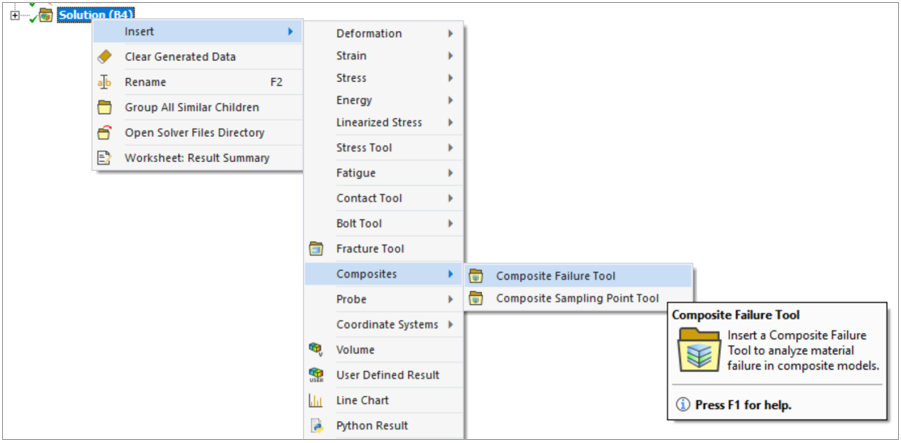
In the Tree View, right-click the Solution group and select Insert > Composites > Composites Failure Tool.
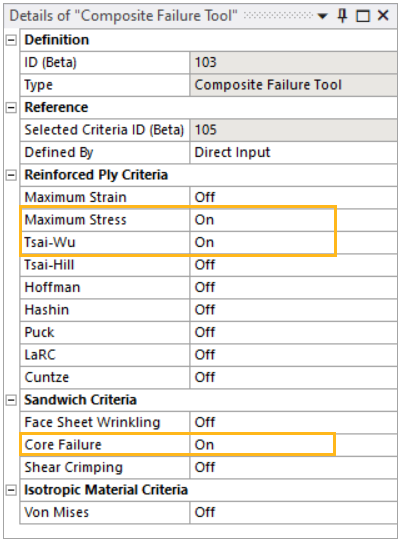
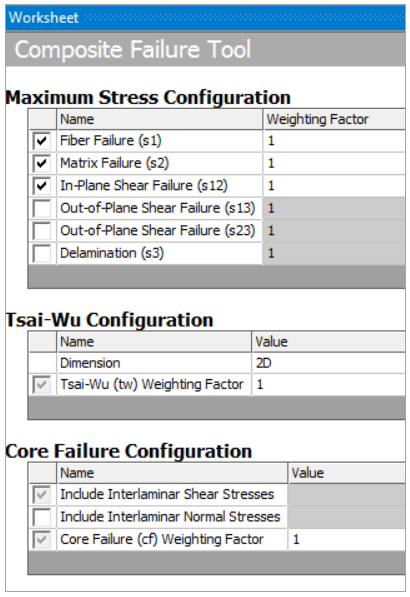
In the details panel of the Composite Failure Tool, under the Reinforced Ply Criteria section, set Maximum Stress and Tsai-Wu to On. Also, under the Sandwich Criteria section, set Core Failure to On.
The Worksheet of the Composite Failure Tool displays the criteria you have specified and provides additional calculation features for each criterion, enabling you to make further specifications.
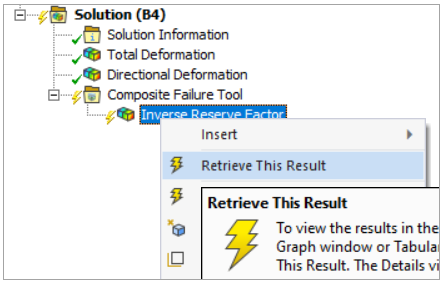
The IRF indicates how close the panel is to failure. It is automatically added under the Composite Failure Tool. From the Tree View, retrieve this result by right-clicking Inverse Reserve Factor and selecting Retrieve This Result.
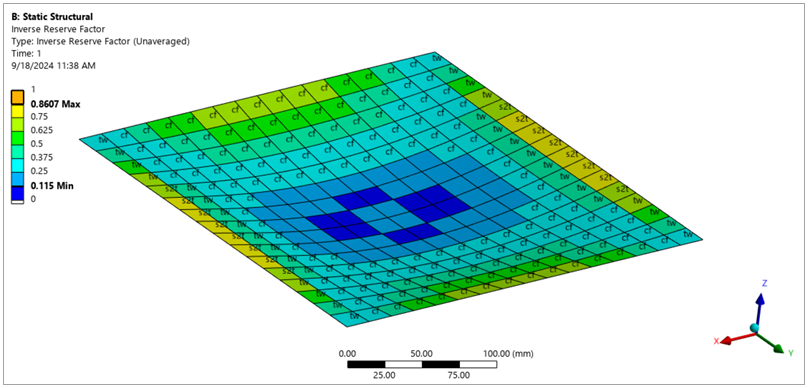
Then check the overall failure plot. The contour plot shows the maximum IRF for each element (across all layers, selected failure criteria, and integration points). The text plot indicates the critical layer (numerical value) and the critical failure mode (text value).
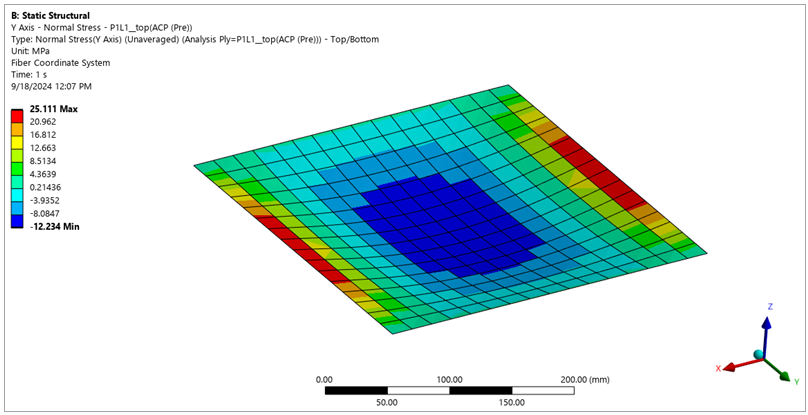
A stress plot is a postprocessing solution that displays stress values at the bottom, mid, or top position of the ply and at the element center (or at the bottom or top of the laminate if ply-wise is disabled).
Define ply-wise stress plots for transverse stresses through the bottom layer of the sandwich top ply by right-clicking P1L1__top (ACP (Pre)) under Imported Plies in the Tree View. Then select Insert for Environment > Stress > Normal.
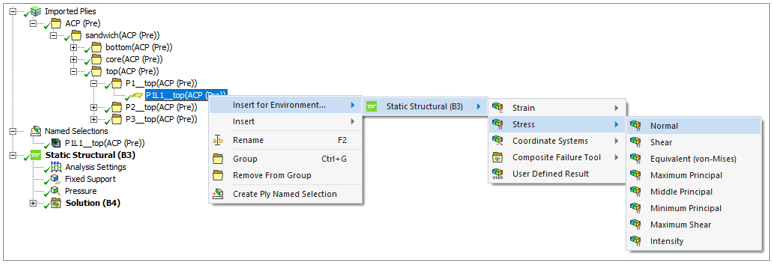
The normal stress distribution along the Y Axis in consideration with the Fiber Coordinate System is shown in the following figure.
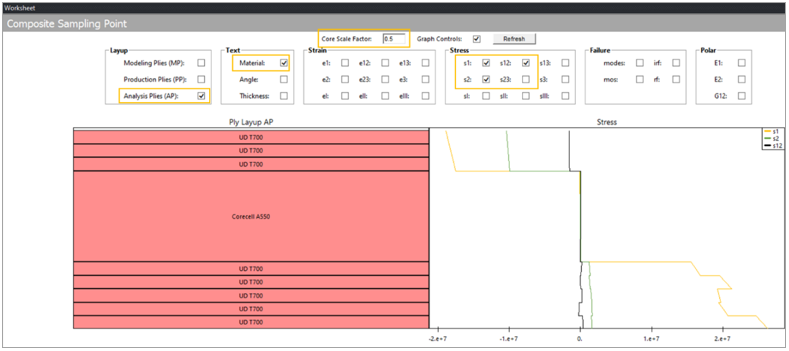
A through-the-thickness plot is one of the post-processing analyses of a sampling point. It shows the through-the-thickness distribution of strains, stresses, or failure results.
Sampling Points are used in post-processing to access ply-wise results. The Composite Sampling Point Tool samples through the specific element near the given coordinates to run detailed analyses (lay-up plots, through-the-thickness plots, and laminate engineering constants).
The through-the-thickness results can be visualized using the Composite Sampling Point Tool. To view the through-thickness plot:
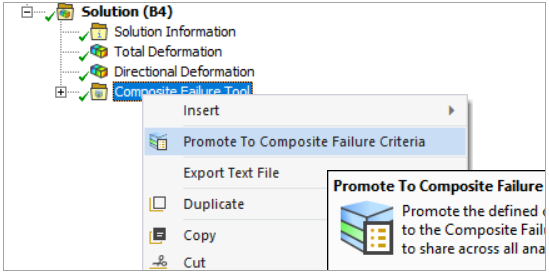
Complete the prerequisite step to enable the Composite Sampling Point Tool: right-click the Composite Faliure Tool and select Promote to Composite Failure Critera.
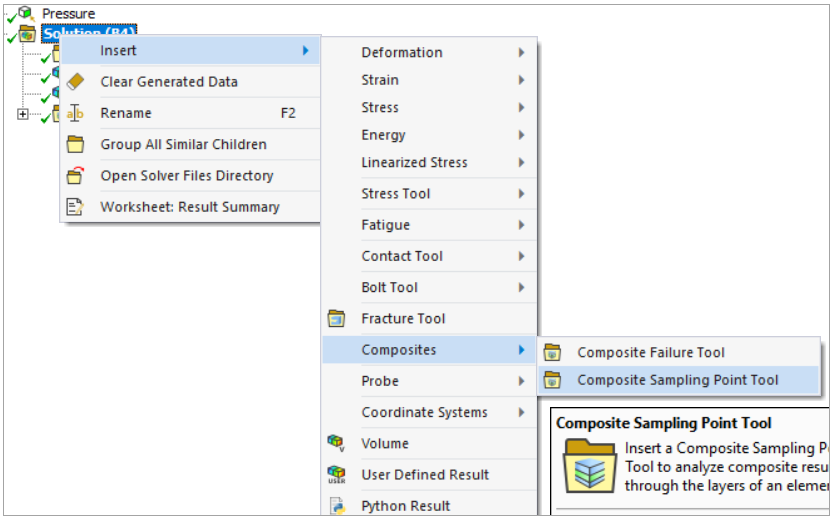
In the Tree View, right-click the Solution group and select Insert > Composites > Composite Sampling Point Tool.
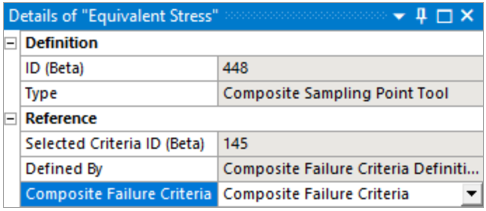
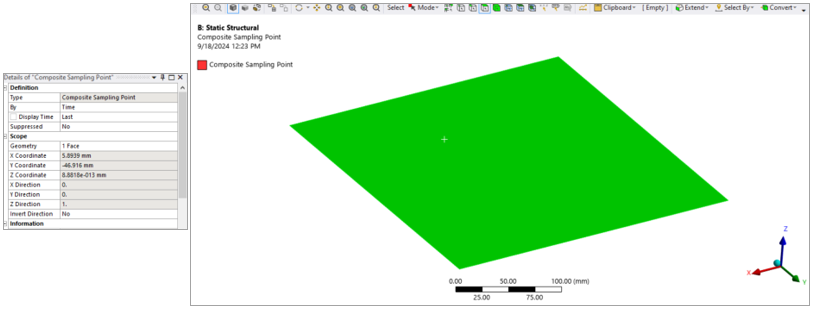
In the Details panel of the Composite Sampling Point Tool, select Composite Failure Criteria to define its respective Reference field.
Selecting the face of the panel automatically defines the coordinates of the sampling point.
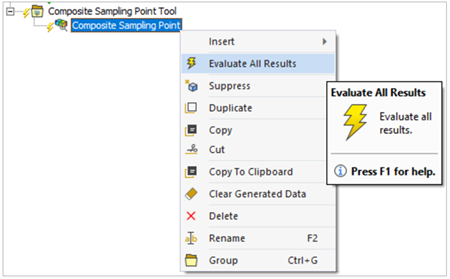
Right-click the Composite Sampling Point Tool and select Evaluate All Results to enable all the features of the tool.
In the Worksheet of the Composite Sampling Tool, set the properties as shown in the following figure.