Following are plots of the sound pressure level (SPL) on the quarter-symmetry model for both the 2D and 3D analyses.
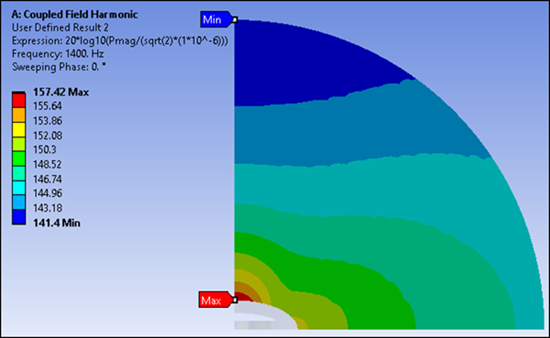
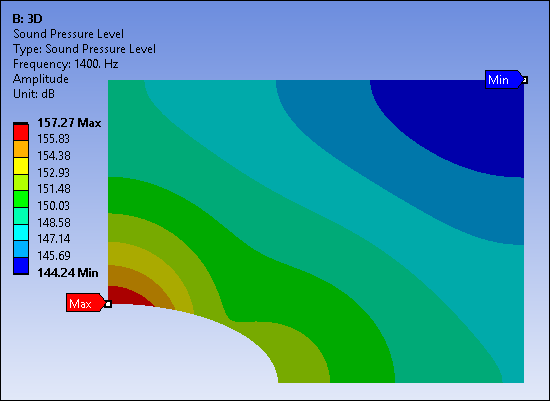
Notice that while the maximum SPL is at the surface of the transducer's minor axis, the SPL near the truncated boundary is lower along the minor axis.
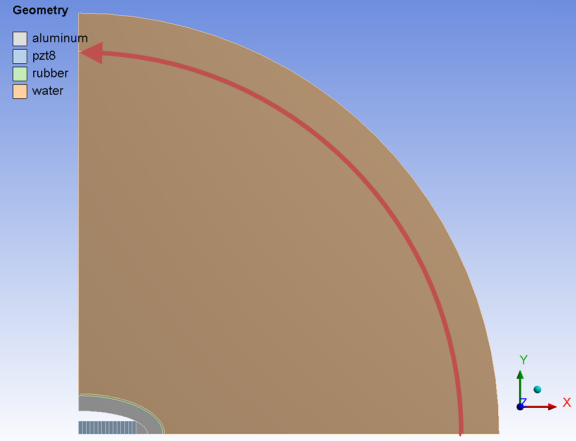
For the 2D model, the following SPL plot along an arc 1 m from the center shows the direction of the arc from the x axis towards the y axis:
The following figures show the 2D and 3D SPL plots:
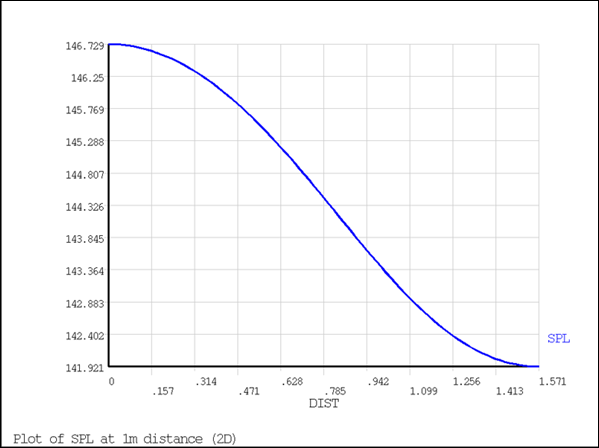
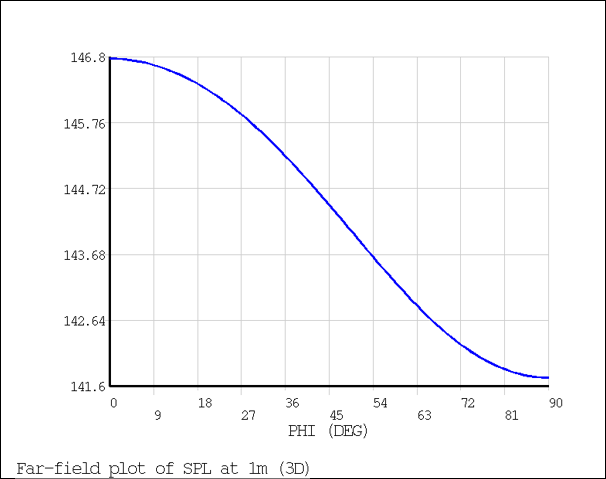
The plots indicate good correlation between the 2D and 3D models.
Additional Information:
The meshes for both cases are not identical, so some variation in the results was expected.
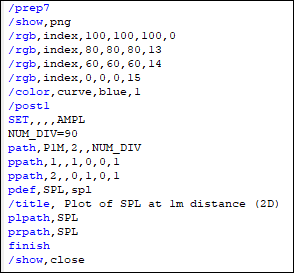
The following command snippet is used to plot Figure 33.17: SPL Plot Along an Arc 1 m from Center: