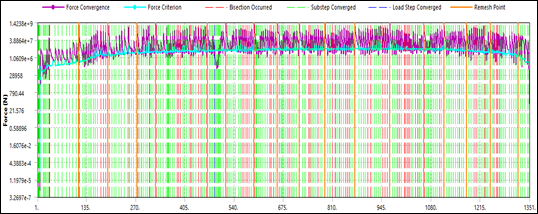
The following figure shows the Force Convergence plot along with remesh points.
When the simulation experiences sudden high stress changes occur at substep 20, it automatically remeshes the affected region to avoid divergence. After that, Nonlinear Adaptivity Remeshing occurs according to the defined recurrence rate.
Note: The results obtained may differ than those reported in the figures below since the Nonlinear Adaptive Region may create a different mesh than the one shown below. The aim of this demonstration is to explain the use of advanced technology in Ansys Mechanical.
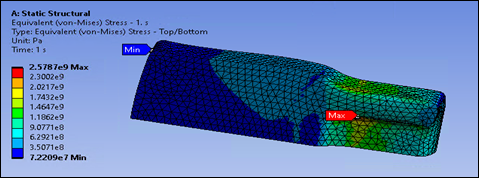
The following figure displays the Equivalent (von-Mises) Stress over time. The green, red, and blue curves plot the maximum, minimum, and average equivalent stress values.
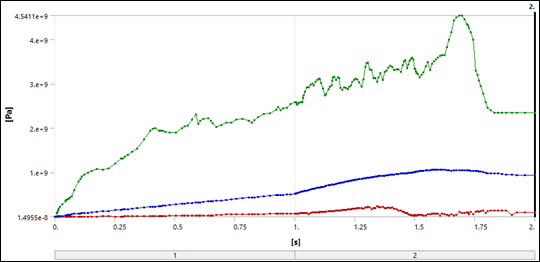
The first re-mesh occurred after sub step 20 (TIME = 0.1277 s) when the side roller makes contact with block and starts pushing on the block, which causes high distortion in elements.
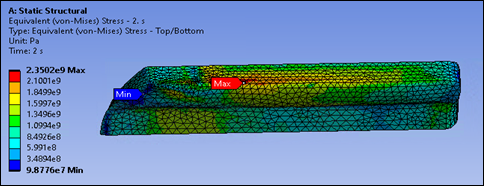
The Block starts to pass between the rollers after the first remesh and begins to take shape.
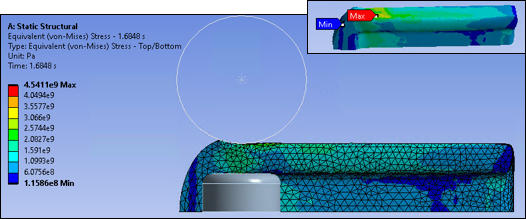
The Block experiences the highest stress at the point of contact detachment between the block and rollers at 1.6848 s.
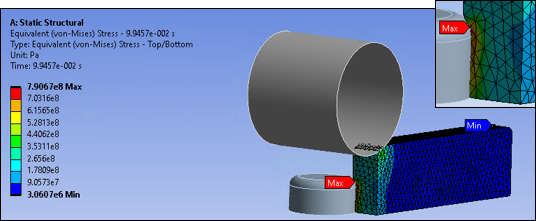
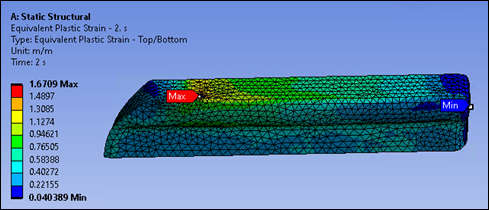
As expected, the high plastic strain region is observed at the location where the web and flange components of the I-beam are connected.
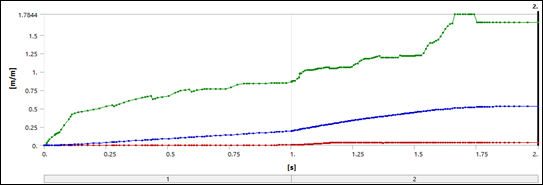
For a period of time during the rolling process (Load Step 2), there is little variation in plastic strain over time in the high plastic strain region. This behavior occurs during the steady-state (rolling) phase of the simulation. The following figure shows the variation of maximum, minimum, and average equivalent strain values over time, represented by the green, red, and blue curves respectively.