Tables do not need to be sorted. The Mechanical APDL solver input generation automatically reorders tables as required. However, you can optionally sort table data by row number or column value to make this data easier to visualize and understand. Sorting only changes the visual representation of the data. Internally, the original order of the data (the row order) is always preserved.
Select the sort order from the drop-down menu at the top of the desired column.
sorts from lowest to highest values.
sorts from highest to lowest values.
cancels the sort and returns the data to its original order.
The application remembers the most recent sort order that you specified.
Note: Displaying a table in unified view can provide additional insight into how dependent variables vary with respect to multiple independent variables.
How Sorting Affects Plots
In free view, variable values are plotted in the same order as they are listed in the table. Sorting this data changes how it is plotted, giving you different views into the relationships between the variables in the table.
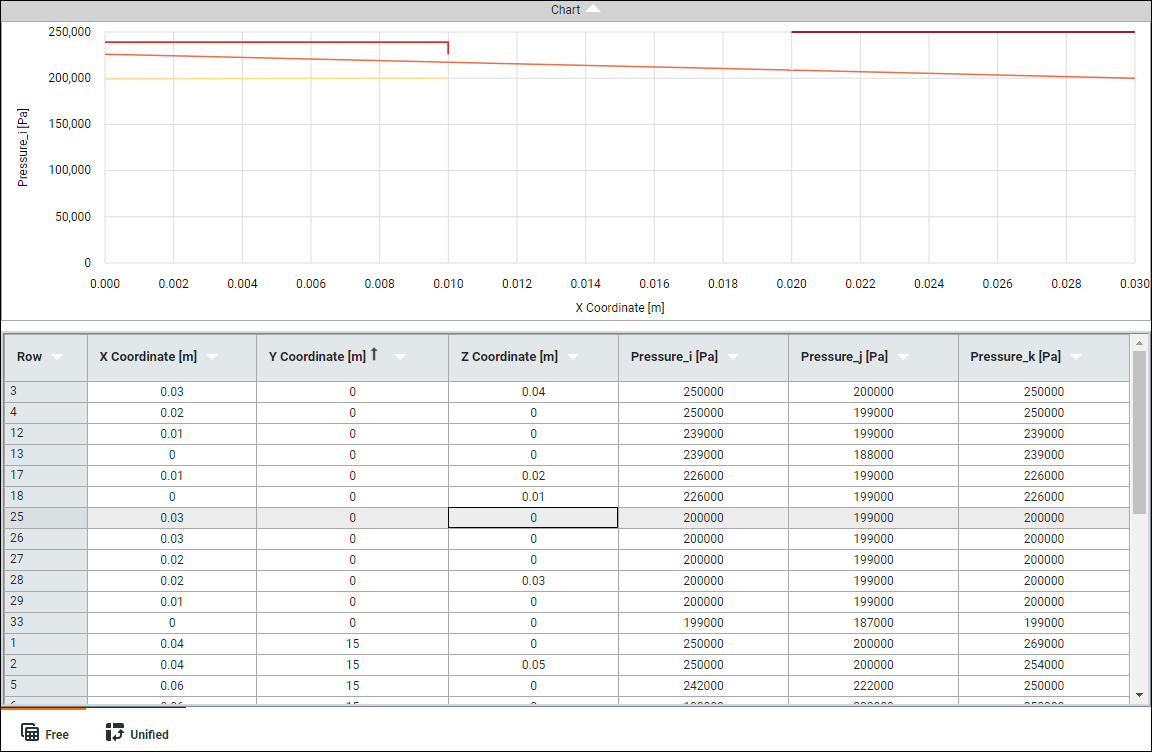
The plot below shows how the X component of pressure (Pressure_i) varies according to the X Coordinate. This data is plotted according to the original row numbering, which is shown in the leftmost column of the table. Pressure_i is on the Y axis and X Coordinate is on the x-axis.
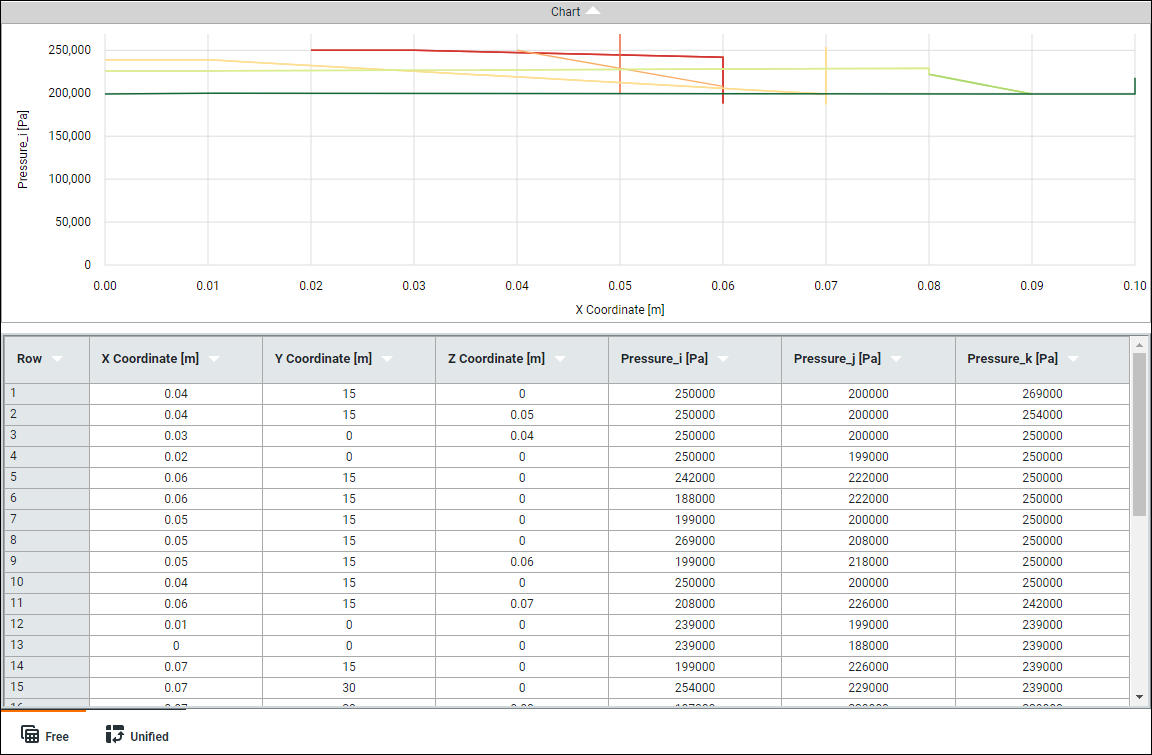
When this data is sorted by Y Coordinate, a different looking plot appears. Pressure_i and X Coordinate are still plotted on the graph below, but the table is now sorted by the value of Y Coordinate. This provides insight into how the pressure at different X coordinates varies by Y coordinate.