


The Harmonic Separation Margin is a result object supported for a Harmonic Response system that calculates the separation margin and generates the Amplitude vs Frequency and Phase vs Amplitude graphs with the custom separation margin results.
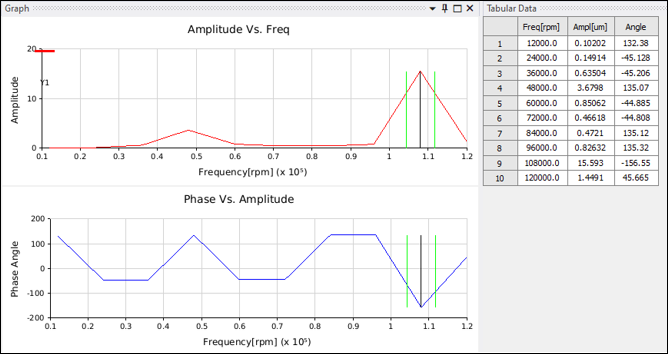
You must set the Peak Amplitude Factor property according to your
specific requirements or standards. The default value is 0.707 of the
value of the peak.
Right-click the Harmonic Separation Margin and select in order to populate the Results of the Harmonic
Separation Margin details panel. This outputs the rotor maximum critical center
frequency (Nc1), the lowest and maximum speed at Peak Amplitude
Factor x Peak Amplitude (N1 and N2), the
Amplification Factor, and the Separation Margin
values.
The Separation Margin is calculated according to the following equation:

Note that you can adjust the coefficients to meet your specific requirements or standards.
The graphs are displayed automatically once the calculations are complete.
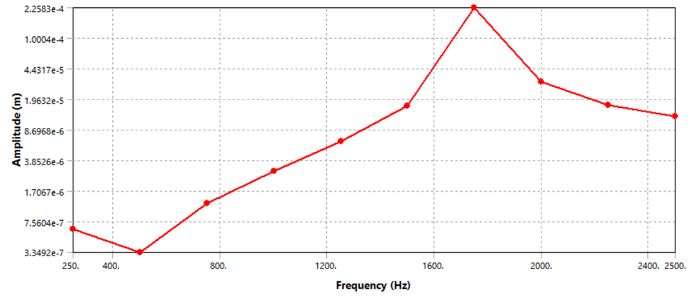
Importance of Resolution
Since the Amplification Factor calculates the peak value where resonance occurs, the resolution of the simulation directly affects the results.
See below for examples with several different frequency resolutions.
Frequency (Hz) vs Amplitude (m) with 10 frequencies:
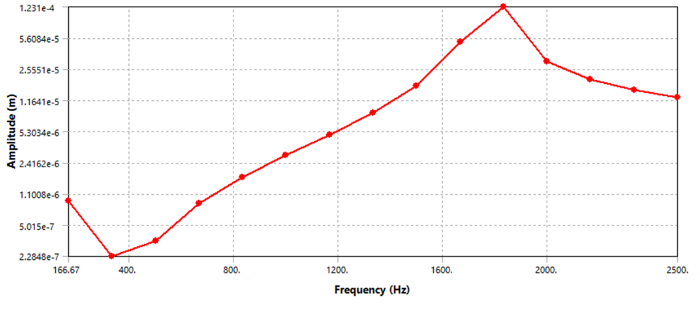
Frequency (Hz) vs Amplitude (m) with 15 frequencies:
Frequency (Hz) vs Amplitude (m) with 20 frequencies.
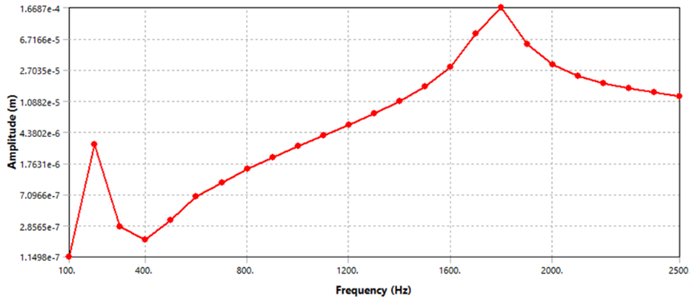
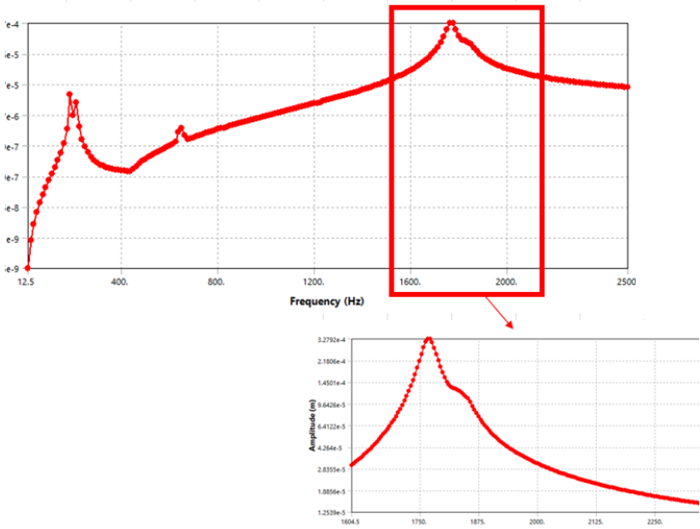
Frequency (Hz) vs Amplitude (m) with a high number of frequencies.
For a constant damping of 0.02, the Amplification
Factor value changes with the resolution of the simulation results until it
starts converging close to a value of 50.
You must ensure that the frequency resolution is sufficient to reach convergence.