


Like Frequency Response results, Phase Response results plot the minimum, average, or maximum Stress, Strain, or Deformation for selected graphical entities (vertex, face, edge, or nodes) or a Named Selection. An example of a Phase Response plot is illustrated below.

However, unlike Frequency Response plots that show a response amplitude over a frequency range, Phase Response plots show a response over a phase period, so you can determine how much a response lags behind the applied load.
The following functions outline the relationships of response amplitude, phase response graphs, and result contours (with associated caveats):
- Response Amplitude
Response Amplitude is defined as the maximum value of the following expression:
value = sqrt(real*real + imag*imag)Where real and imag represent all real and imaginary result values from the result file for the selected frequency.
- Phase Response Graph
Phase Response results report the following quantities at the nearest frequency requested from the Frequency property.
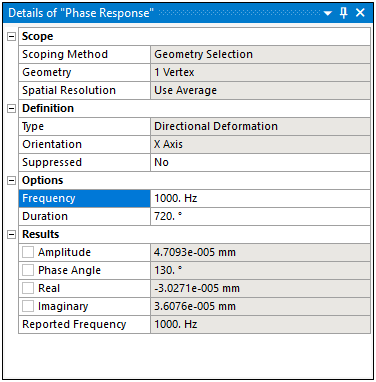
For the properties contained in the Results category:
Amplitude = sqrt(real*real + imag*imag)Phase Angle = 
Real = real Imaginary = imag And the graph is the image of the following, where Sweeping Phase is allowed to vary across a user specified Duration:
value = Amplitude * cos( phase)Where: phase = (Phase Angle + Sweeping Phase) Note: Take caution when comparing the values in the Output column of the Tabular Data for a Phase Response against maximum values of contour displays.
- Result Contour
To draw result contours in a Harmonic Response analysis, the application uses the phase you specify in the Sweeping Phase property to evaluate the expression:
value = real*cos(phase) - imag*sin(phase)Where real and imag represent all real and imaginary result values from the result file for the selected frequency.
Because the formula for the Phase Response graph differs from the formula for the contour, an Output value for the graph does not necessarily equal a maximum for a contour result at the same frequency.
General Approach to Harmonic Response Analysis Postprocessing
Generally speaking, you would look at Frequency Response plots at critical regions to ascertain what the frequency of interest may be. In conjunction with Phase Response plots, the phase of interest is also determined. Then, you can request Stress, Strain, or Deformation contour plots to evaluate the response of the entire structure at that frequency and phase of interest.
Limitations
For a Mode Superposition Harmonic Response analysis (standalone or linked), if the Store Results At All Frequencies property in the Options category of the Analysis Settings is set to , the Phase Response results can be scoped to geometric entities only (node-based scoping is not allowed).
If the Store Results At All Frequencies property in the Options category of the Analysis Settings is set to , the Frequency Response results for force reactions cannot be extracted.