


The Mechanical application calculates the heat flux (q/A, energy per unit time per unit area) throughout the body. Heat flux can be output as individual vector components X, Y or Z.
You can display the X, Y, and Z components of heat flux in different coordinate systems.
Scoping allows you to limit the heat flux display to particular geometric entities. Similarly scoping allows you to get reactions at specific boundary condition objects. Heat flux results can be displayed as a contour plot. You can also capture the variation of these results with time by using a probe.
Plots of Vector Heat Flux
A Vector Heat Flux plot provides the direction of heat flux (relative magnitude and direction of flow) at each point in the body.
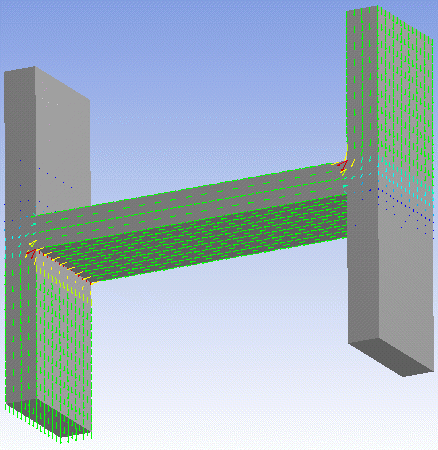
The following graphic illustrates an example showing a high temperature area at the top and a low temperature area at the bottom. Note the direction of the heat flow as indicated by the arrows.
Request Vector Heat Flux plots in the same way that you would request any other result. After inserting the result object in the tree and solving, click the button in the Result Context tab.