


The Pressures and Motions results object enables the visualization and display of a number of results generated from Aqwa once a hydrodynamic solve has been performed. Any number of Pressures and Motions results may be added, as long as the Generate Wave Grid Pressures option in the associated Analysis Settings has been set to Yes (before the solve is performed).
You must define the structures (Parts) that are shown in the result. The Structure Selection field provides a dropdown list that allows you to select any of the Interacting Structure Groups, or structures that do not belong to an interacting group, in the Hydrodynamic Diffraction analysis. An individual structure must have at least one diffracting panel element to be a valid selection. Pressures and Motions results are not relevant for structures consisting only of Morison elements.
The Frequency and Direction options allow you to select a Frequency and Direction from those defined in the Hydrodynamic Diffraction Wave Frequencies and Wave Directions objects. If you have only a single Frequency or Direction defined, the corresponding field becomes read-only, and is automatically updated if the single Frequency or Direction is modified.
The Incident Wave Amplitude can be modified to provide results that are factored from the unit amplitude wave that is the default; extreme modification may extend results beyond the capabilities of a linear analysis, in which case inaccurate results can be produced.
The Result Type can be defined as:
Phase Angle, where an equivalent phase position of the incident wave component can be selected (or is shown in the graph as the time as a proportion of wave period if a sequence is chosen)
Amplitude
Maximum value of the selected result
Minimum value of the selected result
When Phase Angle is selected, Wave Position (Phase) can be set to 0° (t/T = 0) or 90° (t/T = 0.25), or you can enter a specified phase position (in rotation units), or select a sequence of results for animation. If a sequence of results is selected, then the Number of Steps can be selected.
If you select a sequence of results for animation, after you evaluate the Pressures and Motions results (right click on the object and select Evaluate All Results), controls appear that allow you to start, pause, and stop the animation. If a particular result is required from the animated set, click on the graph to display it. Other controls on the graph allow you to change the time over which the animation occurs and create an avi animation file.
Under the Contour Selection section of the Details panel, the Contour Type field allows you to select which results are plotted over the structure or water surface mesh. This field can be defined as:
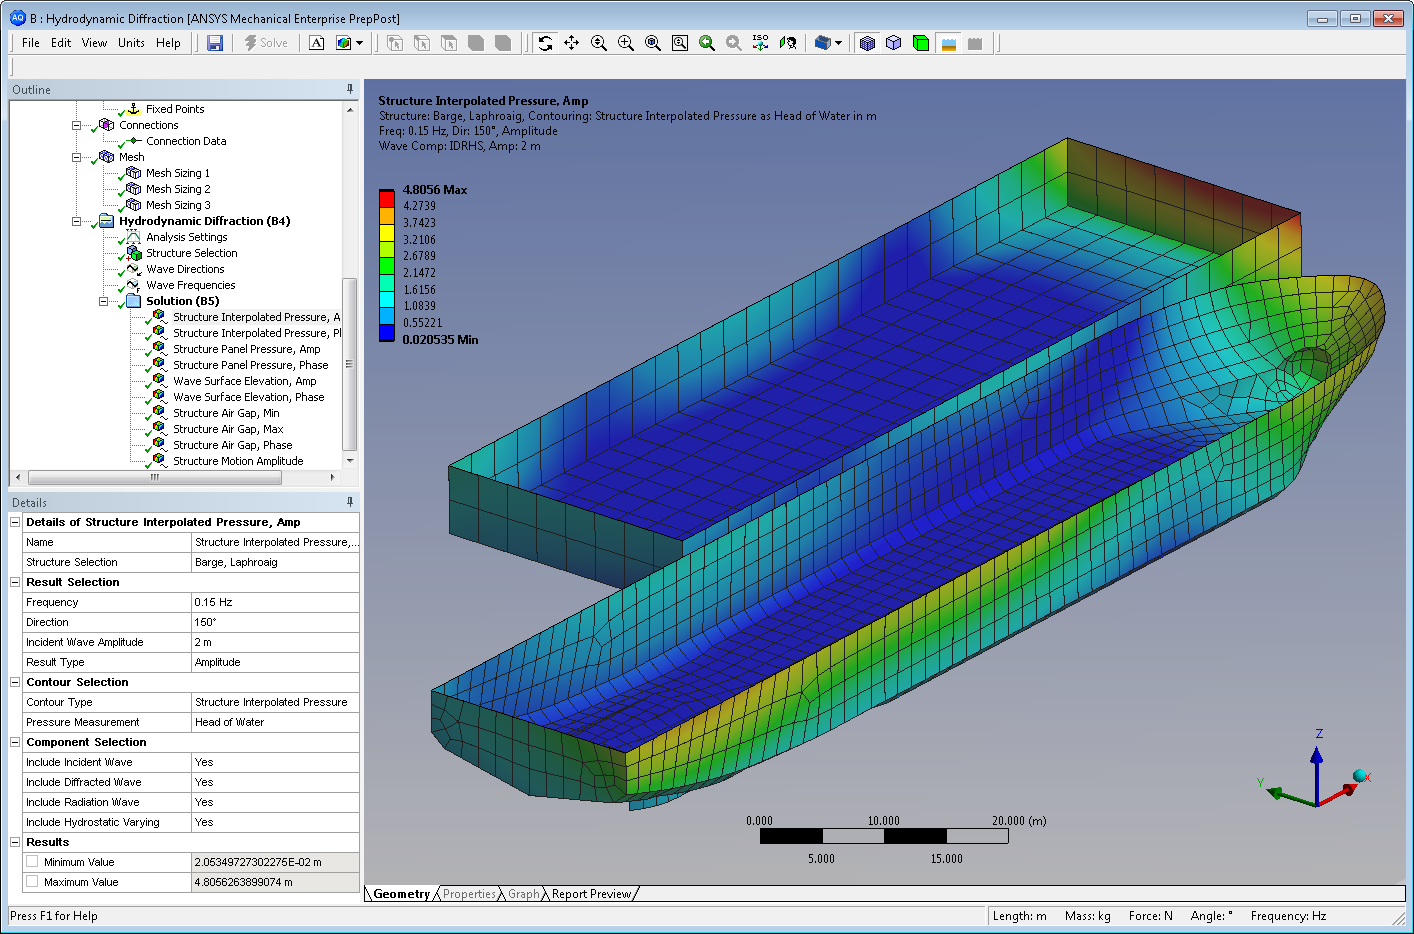
Structure Interpolated Pressure
Structure Panel Pressure
Wave Surface Elevation
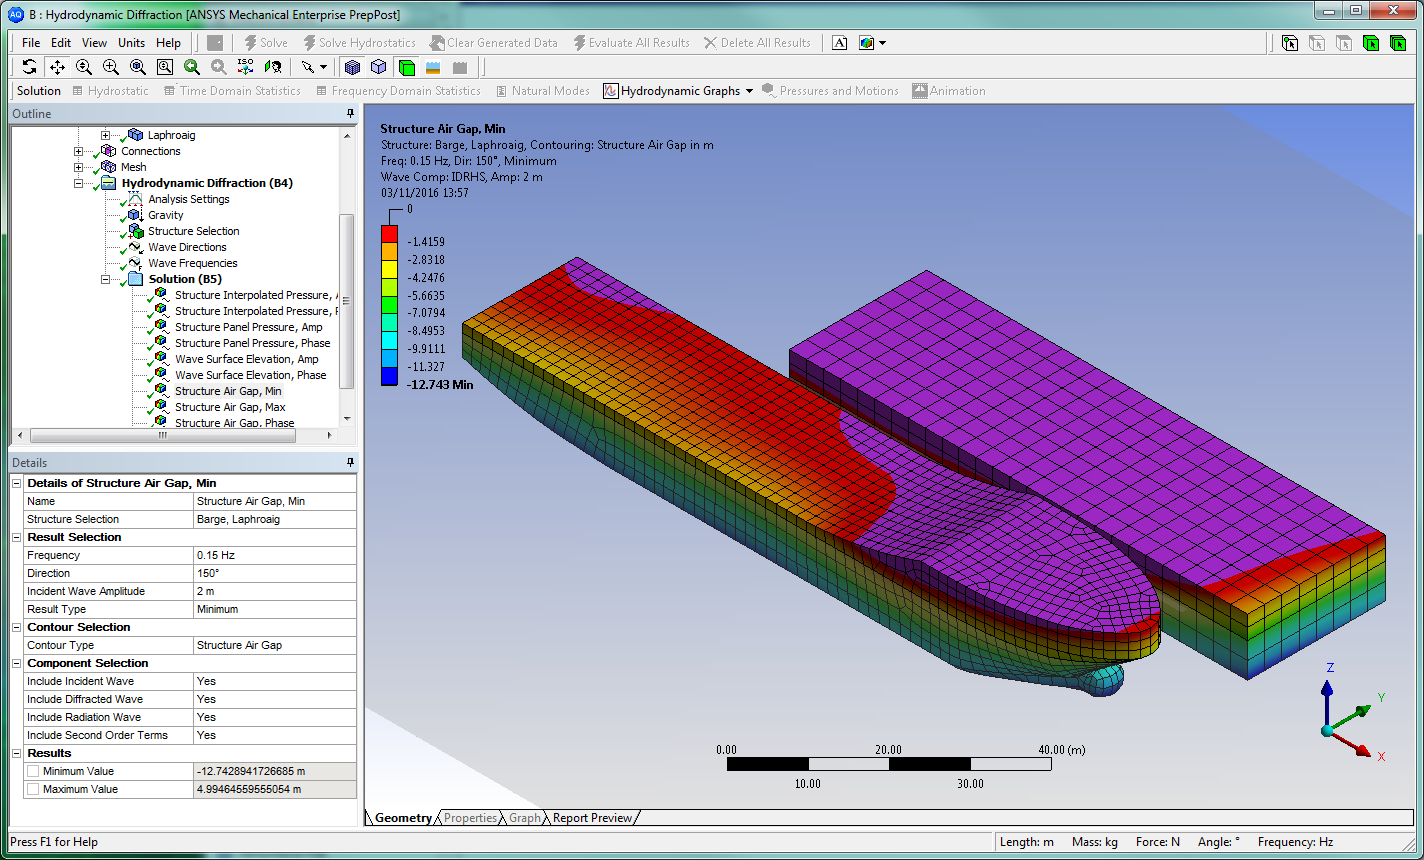
Structure Air Gap
Structure Motion Amplitude
Structure Interpolated Pressure displays element pressures which are interpolated from the nodal pressures calculated by Aqwa. This produces a smoothly-varying contour plot. Conversely, Structure Panel Pressure shows the pressures at the element centroids, and can be directly compared with results in Mechanical once a load transfer procedure has been completed (see The Hydrodynamic Pressure Add-on for more information). When plotting Structure Interpolated Pressure or Structure Panel Pressure, you can use the Pressure Measurement option to change the reported results between Head of Water and Force/Area.
Structure Air Gap plots the vertical distance between the sea surface and any point on the structure, with negative values at a given position indicating that this position is immersed. The contour legend can be adjusted to display a solid color above or below a given value, as shown in the following figure. Air Gaps can only be displayed for a Result Type of Minimum, Maximum, or Phase Angle.
Structure Motion Amplitude displays the displacement or any position on the structure, as interpolated from the nodal displacements calculated by Aqwa. Motion Amplitudes can only be displayed for a Result Type of Phase Angle.
When plotting Structure Interpolated Pressure, Structure Panel Pressure, Structure Air Gap, or Structure Motion Amplitude, and the Result Type is set to Phase Angle, the position of the wave surface is plotted by default. To hide the waves, the Water Elements Shown As option can be changed from Opaque to Dimmed.
When plotting Structure Interpolated Pressure or Structure Panel Pressure, the non-diffracting panel elements are shown with zero pressure values by default. To hide the non-diffracting panels, the Non-Diffracting Elements Shown As option can be changed from Opaque to Dimmed.
Wave Surface Elevation plots the vertical position of the wave surface. In the figure below, plotting the Amplitude of the Wave Surface Elevation highlights the shielding effect of the structures in the lee of the oncoming wave; Mesh Element Outcomes Off is set to provide a clearer image.
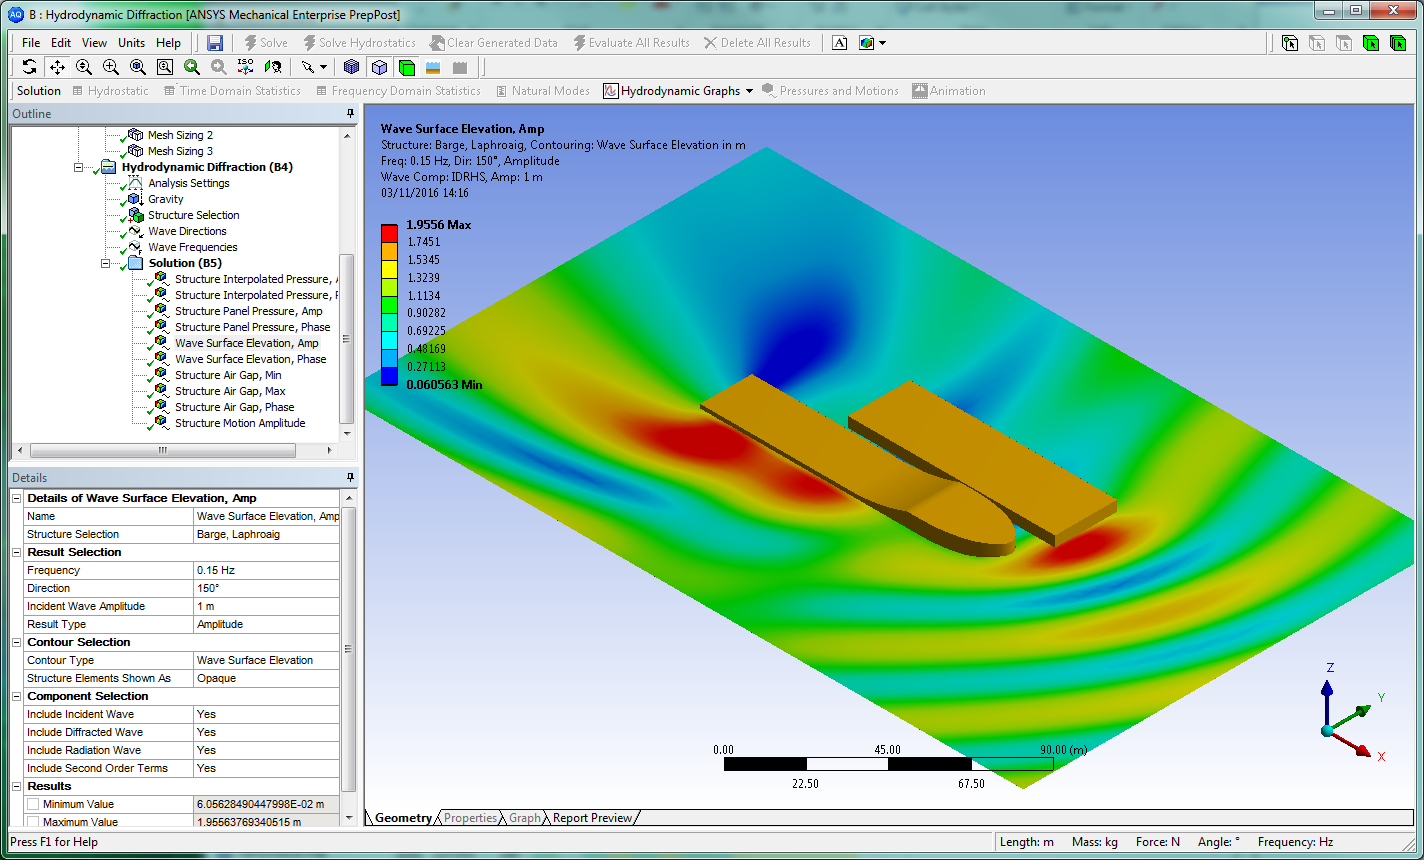
When plotting Wave Surface Elevation, the structure mesh is hidden by default. To show the structure, the Structure Elements Shown As option can be changed from Dimmed to Opaque.
When plotting Structure Interpolated Pressure, Structure Panel Pressure, Wave Surface Elevation, or Structure Air Gap, where the Result Type is set to Phase Angle and the Display RAO-Based Motions option is set to Yes, the RAO-based motion of the structure at the defined phase angle (or sequence of phase angles) is included in the graphical display. While this option is turned on, the wave mesh extends throughout the structure; however, the results that are presented within dry areas are not accurate. Setting the Display RAO-Based Motions option to No fixes the structure in its geometric definition position, and hides any wave mesh that lies inside the structure, except for any Moonpool free surface elements.
Note: The Display RAO-Based Motions option is automatically set to No, and cannot be changed, when the Pressures and Motions Structure Selection includes structures with Moonpools.
When plotting Structure Motion Amplitude, the RAO-based motion of the structure is always displayed and the wave surface is always hidden.
Any combination of wave components can be included in the reported results (exceptions are described in the following notes). To display a particular component, set its corresponding field in the Component Selection section of the Details panel to Yes:
Include Incident Wave
Include Diffracted Wave
Include Radiation Wave
Include Hydrostatic Varying
Include Second Order Terms
Note: The Hydrostatic Varying component is only applicable for Structure Interpolated Pressure and Structure Panel Pressure results.
Second Order Terms are only applicable for Wave Surface Elevation and Structure Air Gap results, and cannot be included if a Forward Speed has been defined in Wave Directions. For Structure Air Gap results, Second Order Terms refers only to the wave surface; the structure motion is always linear in this context.
When plotting Structure Air Gap or Structure Motion Amplitude results, the Incident, Diffracted, and Radiation terms are always included.
The wave mesh size can be altered via the Analysis Settings, Wave Grid Size Factor setting.
The Minimum Value and Maximum Value of the results are shown and can be parameterized.
Once the Pressures and Motions result has been evaluated, you can export data into a comma-separated values (.CSV) file using the Export to CSV File option. For results of Structure Interpolated Pressure, Structure Panel Pressure, Wave Surface Elevation, and Structure Air Gap, when the Result Type is set to Phase Angle and the Wave Position (Phase) is set to Sequence, you can also set Export Phase Angle to define the wave position for which results will be exported.
The content of the exported file depends on the Contour Type, as described below:
- Structure Interpolated Pressure
The .CSV file contains a row for each panel node on the selected structure(s), and has the following columns:
Part name
Surface Body name
Structure node position (X, Y, Z coordinates)
Total nodal pressure
- Structure Panel Pressure
The .CSV file contains a row for each panel element on the selected structure(s), and has the following columns:
Part name
Surface Body name
Element centroid position (X, Y, Z coordinates)
Unit normal vector (X, Y, Z components) for the element orientation
Element area
Total element pressure
- Wave Surface Elevation
The .CSV file contains a row for each water surface node on the selected structure(s), and has the following columns:
Part name
Water node position (X, Y, Z coordinates)
Total wave surface elevation
- Structure Air Gap
The .CSV file contains a row for each panel node on the selected structure(s), and has the following columns:
Part name
Surface Body name
Structure node position (X, Y, Z coordinates)
Total air gap to wave surface
- Structure Motion Amplitude
The .CSV file contains a row for each panel node on the selected structure(s), and has the following columns:
Part name
Surface Body name
Structure node position (X, Y, Z coordinates)
Total nodal motion, real part (X, Y, Z components)
Total nodal motion, imaginary part (X, Y, Z components)