


The Internal Tank Pressures results object enables the visualization and display of a number of results generated from Aqwa once a hydrodynamic solve has been performed. Any number of Internal Tank Pressures results may be added, as long as the Generate Wave Grid Pressures option in the associated Analysis Settings has been set to Yes (before the solve is performed).
You must define the Internal Tanks that are included in the result. The Internal Tank Selection field provides a dropdown list that allows you to select any of the Internal Tanks in the Geometry, or you can select a Part for which all of the associated Internal Tanks will be displayed.
The Frequency and Direction options allow you to select from those defined in the Hydrodynamic Diffraction Wave Frequencies and Wave Directions objects. If you have only a single Wave Frequency or Direction defined in the Hydrodynamic Diffraction analysis, the corresponding field in the Internal Tank Pressures result becomes read-only, and is automatically updated if the single Wave Frequency or Direction is modified.
The Incident Wave Amplitude can be modified to provide results that are factored from the unit amplitude wave that is the default; extreme modification may extend results beyond the capabilities of a linear analysis, in which case inaccurate results can be produced.
The Result Type can be defined as:
Phase Angle, where an equivalent phase position of the incident wave component can be selected (or is shown in the graph as the time as a proportion of wave period if a sequence is chosen)
Maximum value of the selected result
Minimum value of the selected result
When Phase Angle is selected, Wave Position (Phase) can be set to 0° (t/T = 0) or 90° (t/T = 0.25), or you can enter a specified phase position (in rotation units), or select a sequence of results for animation. If a sequence of results is selected, then the Number of Steps can be selected.
If you select a sequence of results for animation, after you evaluate the Internal Tank Pressures results (right click on the object and select Evaluate All Results) controls appear that allow you to start, pause, and stop the animation. If a particular result is required from the animated set, click on the graph to display it. Other controls on the graph allow you to change the time over which the animation occurs and create an .avi animation file.
Under the Contour Selection section of the Details panel, the Contour Type field allows you to select which results are plotted over the internal tank surface mesh. This field can be defined as:
Internal Tank Interpolated Pressure
Internal Tank Panel Pressure
Internal Tank Interpolated Pressure displays element pressures which are interpolated from the nodal pressures calculated by Aqwa. This produces a smoothly-varying contour plot. Conversely, Internal Tank Panel Pressure shows the pressures at the element centroids. You can use the Pressure Measurement option to change the reported results between Head of Internal Fluid and Force/Area.
Note: The Pressure Measurement option is restricted to Force/Area when results are displayed for multiple Internal Tanks with different internal fluid densities.
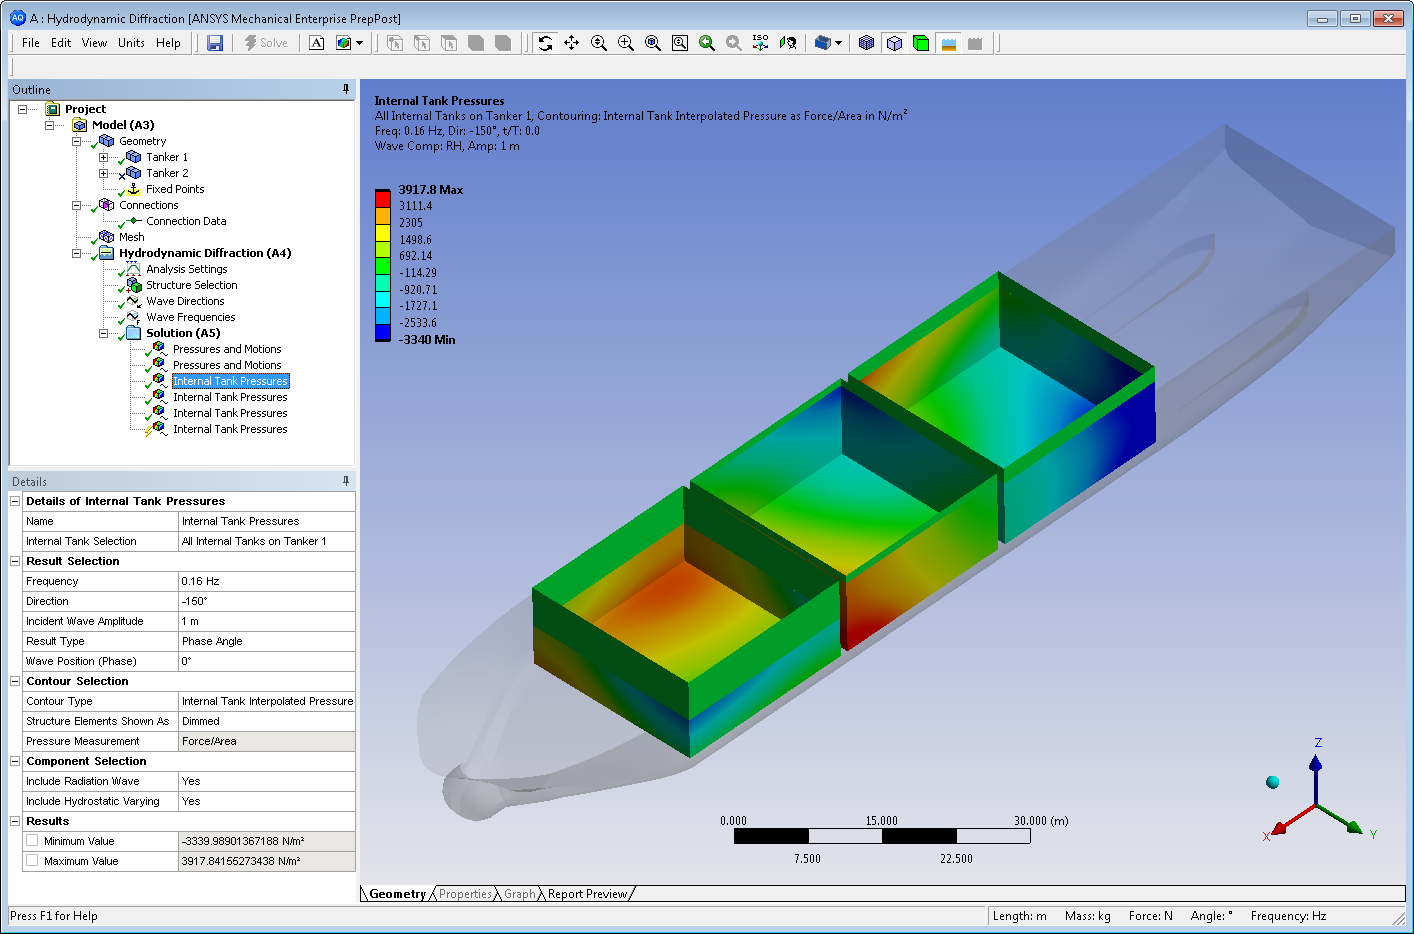
The parts of the structure that do not constitute the Internal Tank(s) selected for display are shown with a high transparency, by default. To modify this, you can change the Structure Elements Shown As option from Dimmed to Opaque.
Any combination of radiated or hydrostatic-varying internal fluid pressure components can be included in the reported results. To display a particular component, set its corresponding field in the Component Selection section of the Details panel to Yes:
Include Radiation Wave
Include Hydrostatic Varying
The Minimum Value and Maximum Value of the results are shown and can be parameterized.
Once the Internal Tank Pressures result has been evaluated, you can export data into a comma-separated values (.CSV) file using the Export to CSV File option. The content of the exported file depends on the Contour Type, as described below:
- Internal Tank Interpolated Pressure
The .CSV file contains a row for each panel node on the selected internal tank(s), and has the following columns:
Part name
Surface Body name
Structure node position (X, Y, Z coordinates)
Hydrostatic pressure, real and imaginary parts
Radiation pressure, real and imaginary parts
- Internal Tank Panel Pressure
The .CSV file contains a row for each panel element on the selected internal tank(s), and has the following columns:
Part name
Surface Body name
Element centroid position (X, Y, Z coordinates)
Unit normal vector (X, Y, Z components) for the element orientation
Element area
Hydrostatic pressure, real and imaginary parts
Radiation pressure, real and imaginary parts