To evaluate mapping quality, check System Coupling's Transcript and EnSight-formatted Results files, as described in the following sections:
Review the Mapping Summary that was generated to System Coupling's Transcript at analysis initialization. It shows the following diagnostics:
- Heat Rate Density:
On all three of the interfaces, 100% of Mechanical's target elements intersect with and obtain loss values from 100% of Maxwell's source elements.
No further investigation of Heat Rate Density mapping is necessary.
- Temperature:
On all three of the interfaces, 100% of Maxwell's target nodes map into Mechanical's source elements and obtain their values from the nodes of those elements.
However, on all three interfaces, Maxwell's target nodes obtain their values from only a percentage of Mechanical's source nodes, as follows:
CouplingInterface-1: 87%
CouplingInterface-2: 89%
CouplingInterface-3: 88%
This is common if the source mesh is finer than the target mesh. Based on these diagnostics, you should open the co-simulation results in EnSight and examine the Temperature mapping more closely.
Figure 19: System Coupling's mapping diagnostics
+-----------------------------------------------------------------------------+
|                               MAPPING SUMMARY                               |
+-----------------------------------------------------------------------------+
|                                     |      Source            Target         |
+-----------------------------------------------------------------------------+
| CouplingInterface 1                 |                                       |
|   Loss 1                            |                                       |
|     Mapped Elements [%]             |       100               100           |
|     Mapped Nodes [%]                |       100               100           |
|     Mapped Volume [%]               |       100               100           |
|   Temp 1                            |                                       |
|     Mapped Elements [%]             |       100               100           |
|     Mapped Nodes [%]                |        87               100           |
|     Mapped Volume [%]               |       100               100           |
| CouplingInterface 2                 |                                       |
|   Loss 2                            |                                       |
|     Mapped Elements [%]             |       100               100           |
|     Mapped Nodes [%]                |       100               100           |
|     Mapped Volume [%]               |       100               100           |
|   Temp 2                            |                                       |
|     Mapped Elements [%]             |       >99               100           |
|     Mapped Nodes [%]                |        89               100           |
|     Mapped Volume [%]               |       >99               100           |
| CouplingInterface 3                 |                                       |
|   Loss 3                            |                                       |
|     Mapped Elements [%]             |       100               100           |
|     Mapped Nodes [%]                |       100               100           |
|     Mapped Volume [%]               |       100               100           |
|   Temp 3                            |                                       |
|     Mapped Elements [%]             |       >99               100           |
|     Mapped Nodes [%]                |        88               100           |
|     Mapped Volume [%]               |       >99               100           |
+-----------------------------------------------------------------------------+
In EnSight, visualize Temperature mapping on each of the three interfaces.
For Mechanical, use the nodal mapping variables. For Maxwell, use the elemental mapping variables. Drag Temperature mapping variables from the Variables pane and drop them on the corresponding participant regions in the Parts pane.
For each coupling interface, the table below shows the Temperature mapping variables associated with each participant region.
Table 1: Bus bar Temperature mapping variables and regions
| Interface | Variable | Regions |
|---|---|---|
|
Coupling Interface 1 |
MappedN_CouplingInterface_1_Temperature |
Ansys Electronics Desktop : bus 1 |
|
UsedN_CouplingInterface_1_Temperature |
MAPDL Steady-State Thermal : FVIN_1_bus1 | |
|
Coupling Interface 2 |
MappedN_CouplingInterface_2_Temperature |
Ansys Electronics Desktop : bus 2 |
|
UsedN_CouplingInterface_2_Temperature |
MAPDL Steady-State Thermal : FVIN_2_bus2 | |
|
Coupling Interface 3 |
MappedN_CouplingInterface_3_Temperature |
Ansys Electronics Desktop : bus 3 |
|
UsedN_CouplingInterface_3_Temperature |
MAPDL Steady-State Thermal : FVIN_3_bus3 |
For the purposes of this tutorial, view the Temperature mapping only on Coupling Interface 3. Figure 20: Temperature mapping on Bus Bar 3 confirms the information provided in the Transcript.
Each target element centroid is receiving temperature data, either interpolated from mapping weights (for mapped locations) or filled in with the value from the nearest source node (for unmapped locations).
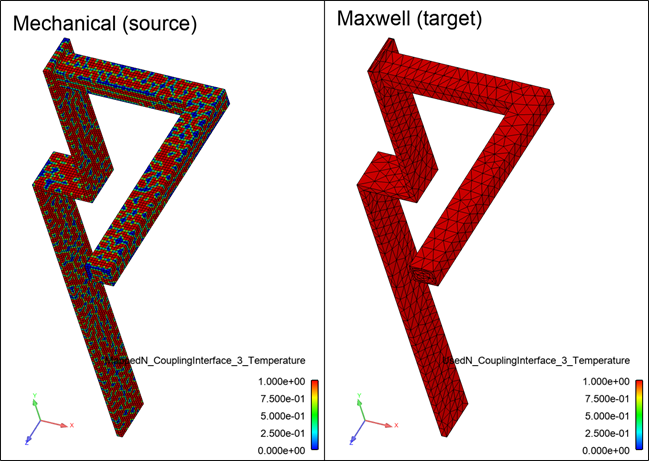
However, not all source-node temperatures are used on the target. This can be attributed to differences between the participants' mesh resolutions and data locations, as described below:
- Mesh Resolution Differences
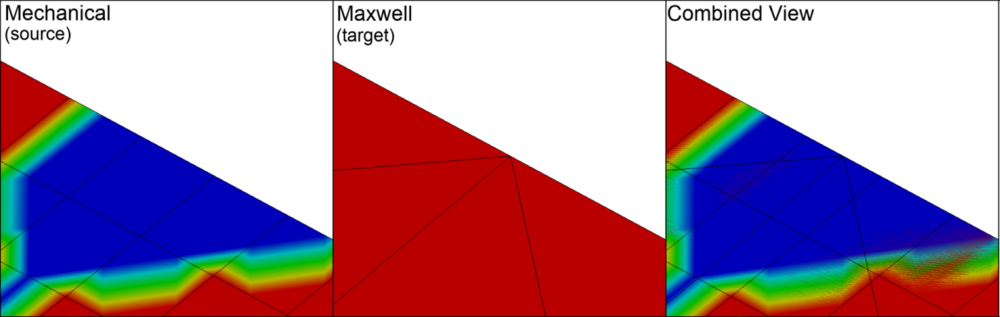
Note that the source mesh is significantly finer than the target mesh. In Figure 21: Unmapped source nodes, mapped target centroids, and combined view, you can see where data from some source nodes are not used on target nodes.
When profile-preserving mapping is used, it is generally better to have a target-mesh resolution that is similar to or finer than the source mesh. This helps to ensure that features that are finely resolved on the source mesh are not lost in the transfer to the coarser mesh.
- Data Location Differences
Remember that Mechanical sends Temperature data from element nodes, while Maxwell receives temperature data on element centroids, which are located inside the mesh for volume elements. The target element centroids on the interior of the bus bar are mapping to the nearest source nodes, which are located beneath the surface of the geometry.