To plot the Temperature vectors, perform the following steps:
On the Results tab under Graphics, click Vectors and select New.
The Vectors dialog opens.
Set Vectors of to Velocity.
Set Color by to Temperature.
The field below updates to Static Temperature.
Set Scale to
0.3.Set Skip to
5.Click New Surface and select Plane.
The Plane Surface dialog opens.
In the Plane Surface dialog, perform the following steps:
Set Method to XY Plane.
Click Create.
In the Outline View, the new surface plane-1 is added under Results \ Surfaces.
Click Close to exit the dialog.
Back in the Vectors dialog under Surfaces, select plane-1 and ensure that no other surfaces are selected.
Click .
The plot is updated in the Graphics Window.
Click Close to exit the dialog.
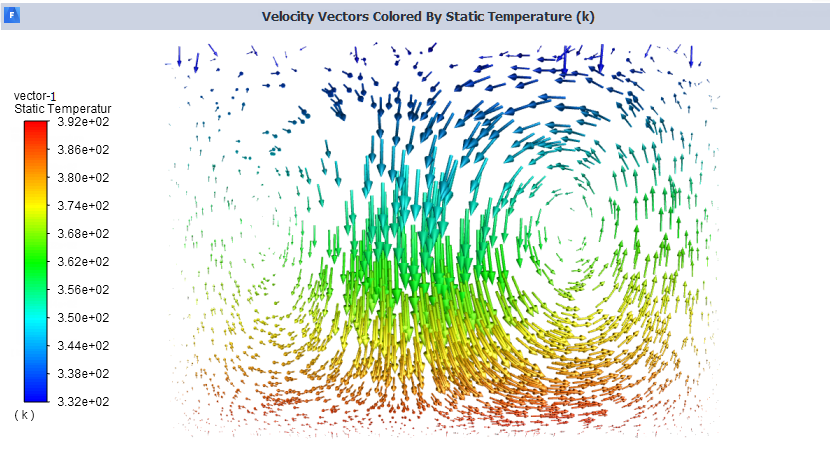
The plotted Velocity vectors are colored by Static Temperature, as shown in the image below.