


Mechanical shock is the sudden application of single or multiple, but non-periodic, physical loads due to acceleration or deceleration that results in significant displacement or deformation. Common events that induce mechanical shock include drops, crashes, firing, impact, or explosions. The performance of a solder joint when subjected to mechanical shock is primarily dictated by the ductility of the solder and the fragility of the interconnect structure (intermetallic region, interface between the bond bad, and the printed board, etc.). The strengths of these regions and the amount of stress transmitted to them during the shock event will determine whether failure occurs. This assessment is based on calculating the board strain (or curvature) for the shock pulse using a transient dynamic finite element analysis (FEA) and equations developed by Steinberg. This strain is compared to the maximum allowable strain, and the probability of failure of the component is predicted.
Tip: Sherlock offers another option for running a Mechanical Shock analysis: It's a fast, non-FE analysis which generates predictions based on strain maps you provide—from an image file or a CSV file. See Strain Mapping in Sherlock.
In this section, the following topics are covered:
The Mechanical Shock Analysis Module makes use of the following input data for the analysis calculations:
Life Cycle Reliability Goals and Mechanical Shock Events
Parts List
Tip: The following section explains which part properties Sherlock uses in the Mechanical Shock analysis: Tables: Required Part Properties per Analysis Type.
Size and location of all parts, through-holes, mount points, and cutouts
Circuit card mechanical properties (stackup data)
Circuit card outline
Mesh properties
Solder properties
If any of the input data listed above is changed, Sherlock will automatically clear the analysis results for this analysis module.
Warning: Exercise caution when using multiple versions of Sherlock on the same project. To avoid inaccurate results, see the section Compatibility with Earlier Versions of Sherlock.
The external loads used during Mechanical Shock analysis are based by one or more Mechanical Shock Events defined in the project Life Cycle. See Life Cycle Management for details.
Mechanical Shock analysis depends on the current placement and type of mount points associated with the circuit card being analyzed. See the section on FEA Mount Points & Fixtures for details concerning the creation and management of mount points.
To specify all input properties and perform mechanical shock analysis, right-click the Mechanical Shock node in the Project Tree and select the Edit Properties option from the context menu. As a convenience, you can also run the analysis immediately, using the last properties entered, by selecting the Run Analysis Task option from the context menu.
Note: Sherlock reports Mechanical Shock analysis results in terms of microstrain. You can enable or disable this feature using the Engine Properties dialog. (On the main menu, go to Settings > FEA Analysis.) See Analysis Properties in this chapter for more information.
Topics in this section:
When using the Generated data source, you may specify the type of model to be generated using the Mesh Type dropdown menu (Merged or Bonded) and other mesh properties using the Mesh Properties form. Each mesh property form is selectable by the indicated tabs. See the FEA Overview for more details.
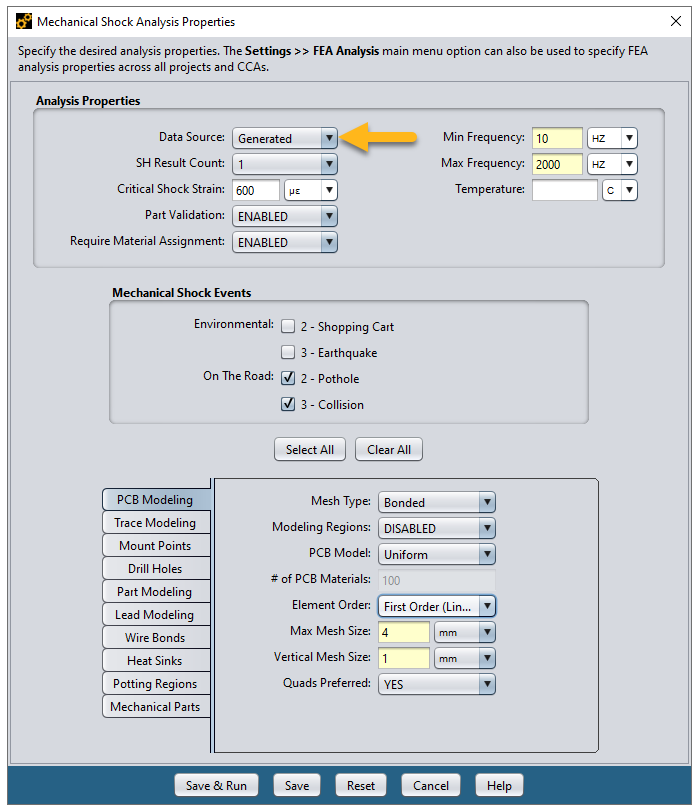
The Analysis Properties form allows users to specify the range of frequencies used for a natural frequency scan, which is required for all FEA processing and is automatically performed by Sherlock.
The SH Result Count property specifies the number of shock displacement result layers to be generated. Results are chosen based on maximum nodal displacement in the result step.
Critical Shock Strain is the maximum strain a component can experience without being overstressed. By default, the field is blank. When blank, Sherlock calculates critical shock strain for each component based on its dimensions.
If the FE analysis determines that the PCB surface strain under the component's footprint is greater than the calculated critical shock strain and if the cycles-to-failure for the PCB surface strain of the component's footprint is lower than 1000 cycles, then Sherlock classifies the failure as overstressed.
In cases where the calculated critical shock strain is greater than the PCB surface strain and the calculated cycles-to-failure is greater than 1000, then this condition is not considered to be an overstress failure. Generally, a component surviving 1000 cycles is not considered prone to overstress.
However, when you explicitly provide a critical shock strain value and the PCB surface strain under the component's footprint is higher than the critical shock strain, then Sherlock will not overwrite your definition of overstress and will treat the component as having failed from overstress.
The Mechanical Shock Events form displays a list of all Shock Events you have created. (See Shock Event in the Sherlock User's Guide for a review on creating Life Cycle Events.) You can select which Events you want included in the analysis. Sherlock will automatically perform a separate analysis for each Mechanical Shock Event selected in the list.
Tip: The Numeral Damping setting (Damping Modifier in earlier versions of Sherlock) is located in the Sherlock Settings dialog ( tab panel). See FEA Analysis Settings for additional information.
Note: If you wish to import LS-DYNA analysis results, see the section below, LS-DYNA Imported Data Source.
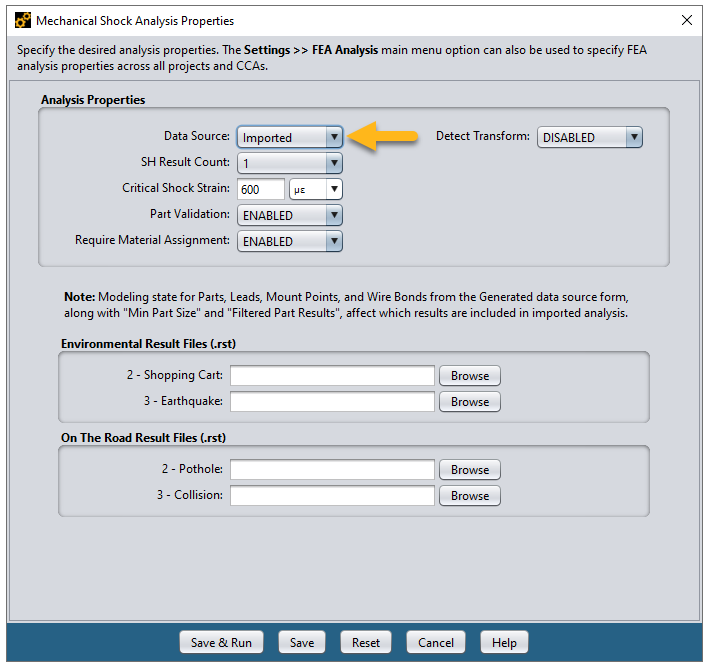
Mechanical Shock analysis results can be imported into Sherlock by selecting the Imported data source. When selected, as shown here, you must enter the locations and names of the model and results files (.rst) used for the Mechanical Shock event analysis runs.
Tip: For detailed, step-by-step instructions for importing results from Ansys Workbench, see the following section: FEA- Ansys Workbench Integration.
When the Detect Transform is ENABLED, Sherlock will attempt to detect any Transforms applied to the imported model and make adjustments if required. This ensures the imported model matches Sherlock's original model. Select MANUAL to enter Transform properties manually. If a Transform exists and is not detected, Sherlock will not be able to provide component results. When running the Detect Transform feature, Sherlock uses multiple threads by default. To learn more about this feature and how to adjust it, see Transform Detection Threading under FEA Analysis Settings.
If any of the event result file entries are blank, then Sherlock will assume that no analysis was performed for those events.
When the Save & Run button is pressed, Sherlock will import both the model and the results to determine the reliability results.
Note: When importing data, it is your responsibility to assign the proper results file to each event. Sherlock has no other way of determining the association.
Note: If lead results are not generated after importing results which contain leads, enable Lead Modeling on the Generated Data Source form and perform the imported analysis again
Select the Strain Map Data Source to generate reliability predictions based on data from strain map images and CSV files. See Strain Mapping in Sherlock below.
To import LS-DYNA analysis results, select the LS-DYNA Data Source as shown below. This selection is available only for Mechanical Shock Analysis, and you must have selected Ansys as the Analysis Engine (see the section above, Selecting the FEA Engine).
Using the interface shown below, enter the directory that contains all the d3plot and input.k files generated from the LS-DYNA analysis.
Note: Before importing LS-DYNA results, decide what kind of results you want to see. Sherlock gives you two options: Max Over Time or Max Displacement Time.
Max Over Time: When reporting strain for an element, Sherlock considers all time steps and reports the maximum stress the element saw. This means the strain result for one element may represent a different time step than that of another element.
Max Displacement Time: The reported strain results for all elements will come from the same time step—the time when maximum displacement occurred.
The LS-DYNA Strain Settings option is found in Sherlock's menu. From the Main Menu: .
Limitation: When LS-DYNA is selected as the Data Source, Sherlock will not calculate strain results for orthotropic materials.
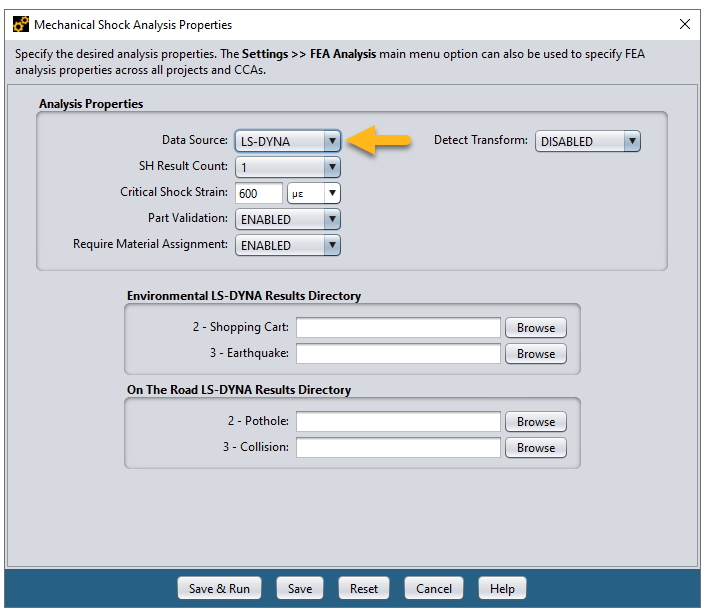
When the Detect Transform is ENABLED, Sherlock will attempt to detect any Transforms applied to the imported model and make adjustments if required. This ensures the imported model matches Sherlock's original model. Select MANUAL to enter Transform properties manually. If a Transform exists and is not detected, Sherlock will not be able to provide component results. When running the Detect Transform feature, Sherlock uses multiple threads by default. To learn more about this feature and how to adjust it, see Transform Detection Threading under FEA Analysis Settings.
If any of the event result file entries are blank, then Sherlock will assume that no analysis was performed for those events.
When the Save & Run button is pressed, Sherlock will import both the model and the results to determine the reliability results.
Note: Sherlock currently supports only the standard solid elements with one point integration. For additional information on this, refer to the following sections in the LS-DYNA Keyword User's Manual:
Volume 1, section 1-357 for a brief explanation of solids
Volume 1, section 37-68 on SECTION_SOLID
The Mechanical Shock Analysis Module generates the following types of results:
Overall summary of the scores assigned to each part analyzed,
Maximum displacement and strain values across all parts and shock events analyzed,
Table of maximum displacement and strain values for each part analyzed, and
Graphical layers showing color-coded part scores (top and bottom sides), and
Graphical layers showing maximum displacement and strain during shock events.
Note: Remember, when you view the analysis results from an imported LS-DYNA file, how the results are displayed depends on which option you chose: Max Over Time or Max Displacement Time. These settings are explained above in LS-DYNA Imported Data Source.
We'll now look at each of these types of results.
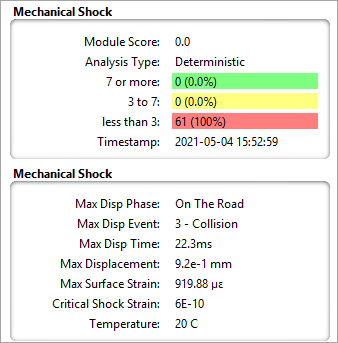
The Summary Panels, shown below, for the Mechanical Shock Analysis Module provide an easy-to-read overview of the results for all parts analyzed. A break-down of the scores assigned to each part analyzed is provided, clearly showing the relative number of problems found.
The second summary panel also shows the Life Cycle Phase and Life Cycle Shock Event that caused the maximum displacement of the circuit card. The time of maximum displacement (relative to the start of the shock pulse defined for that event), as well as the predicted displacement and resulting strain, is listed. Although each of the shock events contributes to the predicted lifetime for the parts, you can use these maximum values as a sanity check of the results based on the Life Cycle definitions.
Select the Shock sub-tab at the bottom of the results panel to view the detailed results for each part analyzed. The color-coded tabular results produced by the Mechanical Shock Analysis Module provide a convenient way to focus on the specific parts that may fail prematurely because of mechanical shock events.
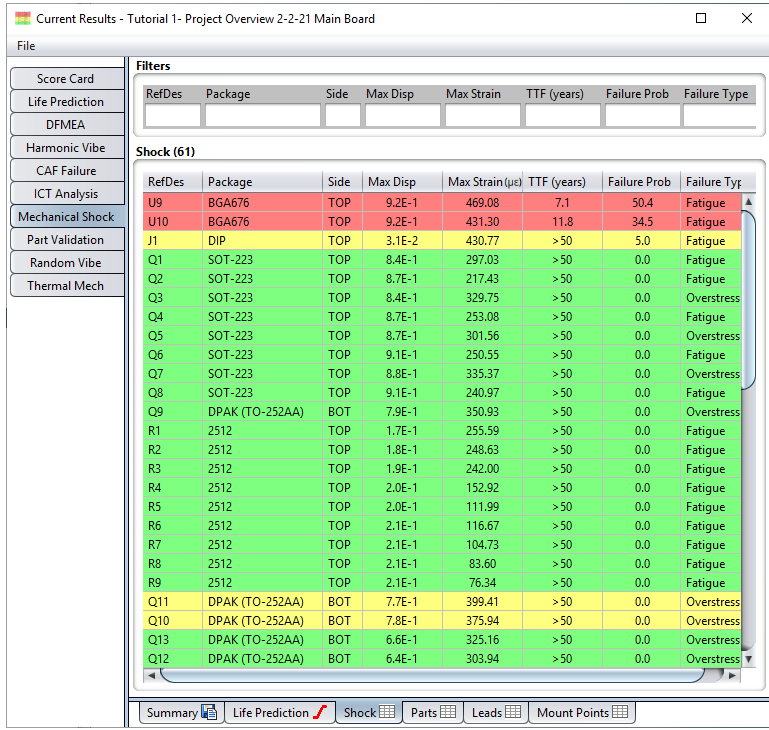
As with other color-coded displays in Sherlock, RED means that the predicted score is less than 3 (less than a 3X safety factor), YELLOW means the score is between 3 and 7, and GREEN means that the score is 7 or more, indicating there is a very small probability that the part will fail. In this case, we see that two parts are predicted to have significant problems, falling well short of the desired Life Cycle Reliability Goals, with many others in the Warning range.
Note: The Settings > Score Settings editor can be used to change the score-color mapping to suit your specific needs.
You can double-click any row in the table to view all the properties associated with a selected part. When viewing current results, the properties will be from the current Parts List. When viewing archived results, the properties will be from a snapshot of the Parts List taken at the time the archive was made.
You can export one or more rows from the results table by right-clicking a row and selecting the Export Table option from the context menu. See the section on Reporting and Data Export more details. You may also view the life prediction chart for any selected part by selecting the View Life Prediction option from the context menu on the table.
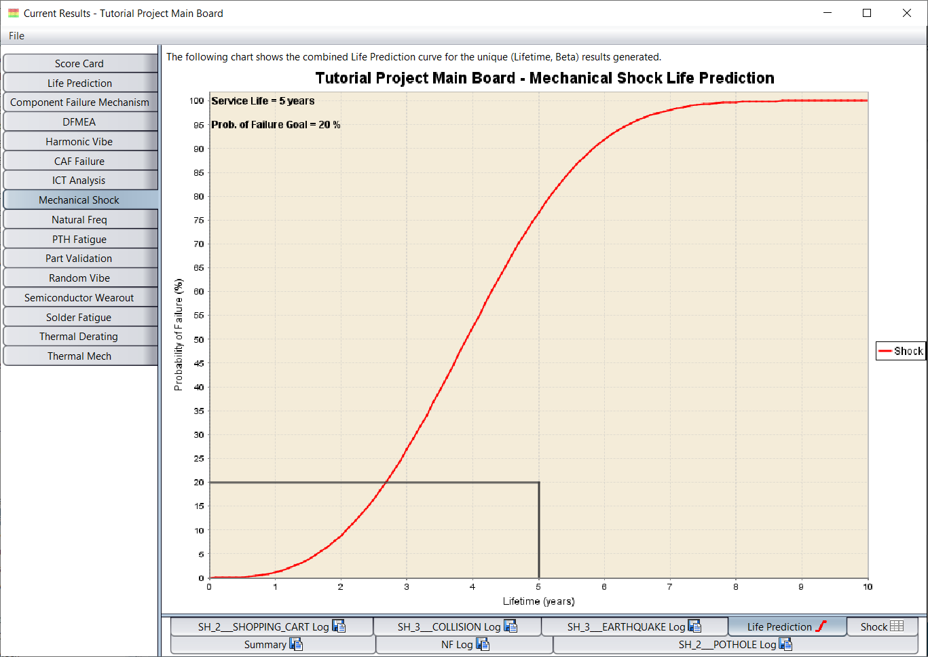
A Life Prediction curve can be generated for the circuit card itself, based on the Life Prediction curves for each of the parts analyzed, as shown here:
Limitation: Time-to-failure calculations for leads are not available in the Mechanical Shock Analysis. It is planned as a future enhancement.
The Life Prediction chart shows all the critical information about circuit card reliability over a long period of time. The rectangular region in the lower left-hand corner of the chart graphically shows the desired Reliability Goals for this project, bounded on top by the desired Probability of Failure and bounded on the right by the desired Service Life. If the curve stays below the top line up to the Service Life, then the circuit card is predicted to meet its goals. In this case, the circuit card fails to meet its reliability goals when subjected to the mechanical shock events defined in the Life Cycle.
The Mechanical Shock Analysis Module generates graphical layers depicting component scores for the top and bottom sides of the PCB. Such displays can be used to quickly correlate potential problems with geographic and/or dimensional properties, as shown here:

In this case, the color-coded FEA Scores – SH Top layer clearly shows the problem parts. It also shows the relative scores of all parts analyzed. Notice, the colored-region for each part analyzed are always displayed in the score layer, even though we are filtering parts smaller than 5mm in the Components – comp-top layer. We see that the troubled parts are located symmetrically around the center of board, almost exactly half-way between the center of the board and the 4 corner mount points. The regions in which the parts are located must be experiencing the highest strain during the shock pulse.
The Mechanical Shock Analysis Module also generates graphical result layers showing the maximum displacement and strain values experienced during the worst shock event analyzed. For example, the following image shows the maximum displacement values, which occurred 20.4 ms after the start of the shock event (the Summary Panel indicates which shock event caused by maximum displacement):
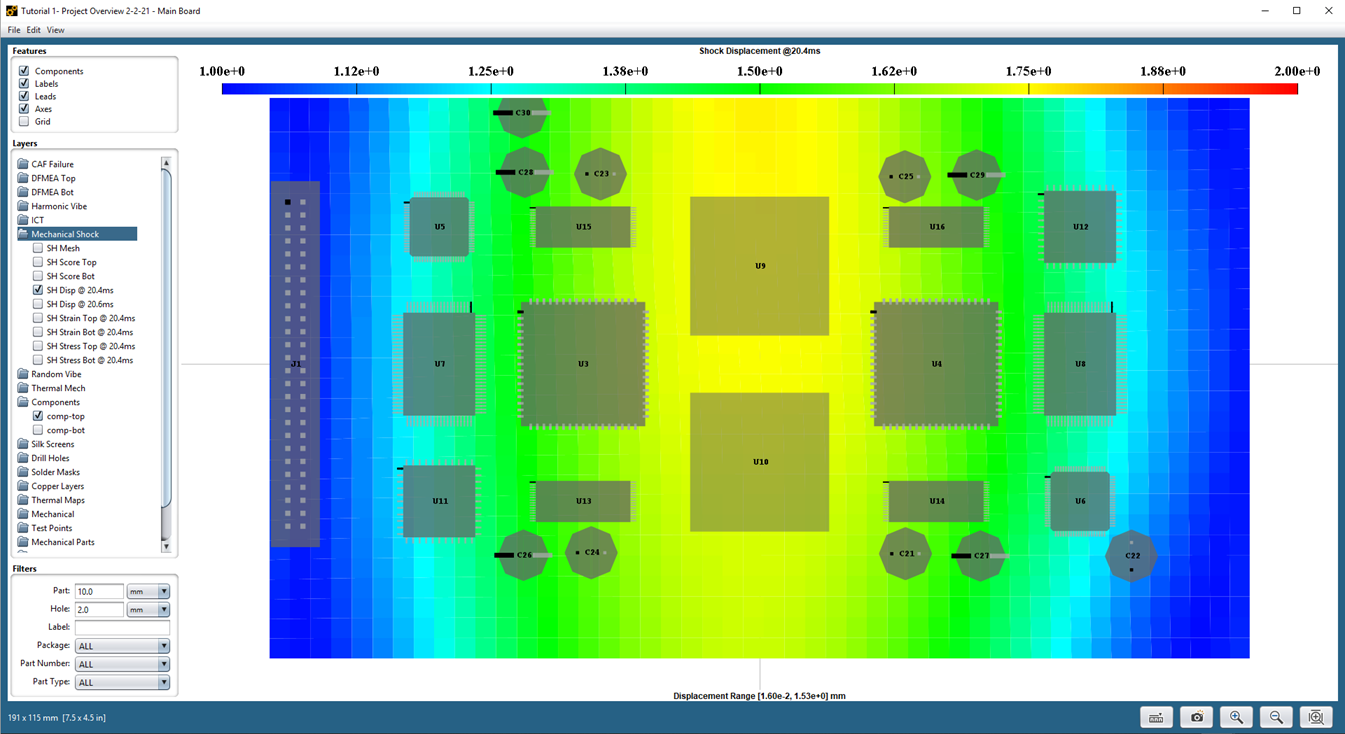
The color legend indicates the range of displacement values being displayed (in this example, from 1.00 mm to 2.00 mm). You can customize the color range using the Settings > Color dialog. See the FEA Overview for more details.
You can view the 3D FEA model and/or results by right-clicking the Mechanical Shock node in the Project Tree and selecting either the View 3D Model or View 3D Results option from the context menu. In both cases, the Sherlock 3D Viewer will be launched allowing you to interactively view the 3D data. See Viewing and Managing Analysis Results for more details.
Note: In the 3D Viewer, when viewing any of the color schemes related to material properties (Material CTE, Material Conductivity, Material Density, and Material Elasticity), the values represented are for the material at 20°C only.
If the Show FEA Logs option is enabled in the Settings > FEA Analysis dialog, then a Log Panel will be displayed along with the other analysis results containing the log generated by the FEA engine during the analysis process. Advanced users can review such log data to determine if everything was processed as expected and/or to trouble-shoot FEA processing issues.