


Consider a fluid for which you have the following experimental data for the shear viscosity vs. the shear rate:
| Shear Rate (1/s) | Shear Viscosity (Pa-s) |
|---|---|
| 0.01 | 4000 |
| 0.10 | 900 |
| 1.00 | 200 |
| 10.00 | 50 |
| 100.00 | 10 |
| 1000.00 | 1 |
This data is displayed on a log-log plot in Figure 1.3: Log-Log Plot of Shear Viscosity vs. Shear Rate.
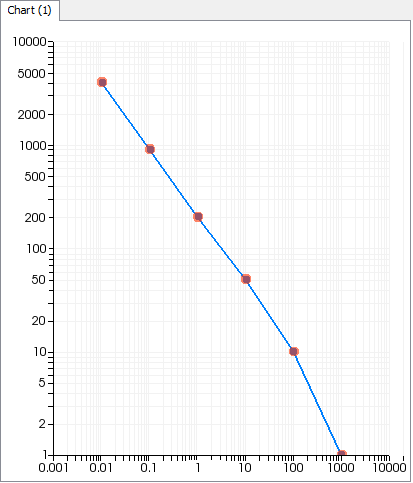
With a little experience, you can easily identify which viscous behavior the fluid seems to obey. In particular, for this case, you can observe that the viscous behavior of the fluid seems to follow the power-law model, which is one of the generalized Newtonian models available in Ansys Polymat.