


There are several attributes of the axes that you can modify: axis name, format and precision of the numbers attached to axis markers, and the scale and limits of the displayed numbers. All of these attributes are specified in an axis tab of the Properties dialog box. To open the Properties dialog box associated with the current chart, right-click in the chart and select Properties from the menu that opens. The attributes for the x axis are shown in Figure 8.6: The X Axis Tab of the Properties Dialog Box.
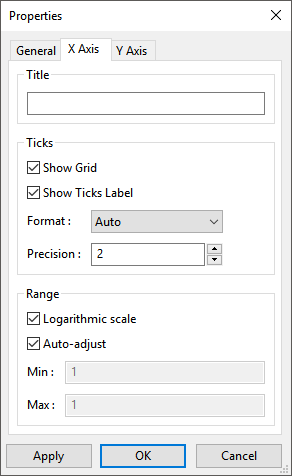
To define a new name for the axis, specify it in the Title text-entry box.
The Ticks group box allows you to specify whether you want to show gridlines in the chart (via the Show Grid option), and whether to display numbers for the axis markers (via the Show Ticks Label option). Note that the Show Grid option must be disabled in both axes' tabs to remove the gridlines. The Ticks group box also allows you to specify the Format and Precision of the numbers. Three formats are available for the numbers:
Auto (that is, as many decimal places as necessary)
Scientific (for example, 1.20e+001)
Fixed (that is, two decimal places)
The Range group box allows you to specify whether a linear or a logarithmic (base 10) scale is used for the axis (via the Logarithmic scale option). When the Auto-adjust option is enabled, the scale of the axis automatically adjusts to show all of the data points; when disabled, the axis only shows the range specified via the Min and Max number-entry boxes.
The changes you specify will not take effect until you click Apply or in the Properties dialog box.