


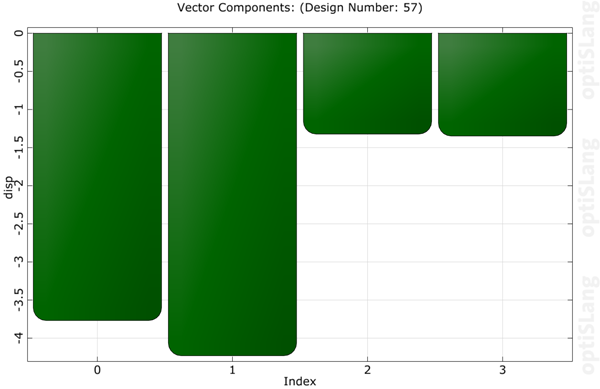
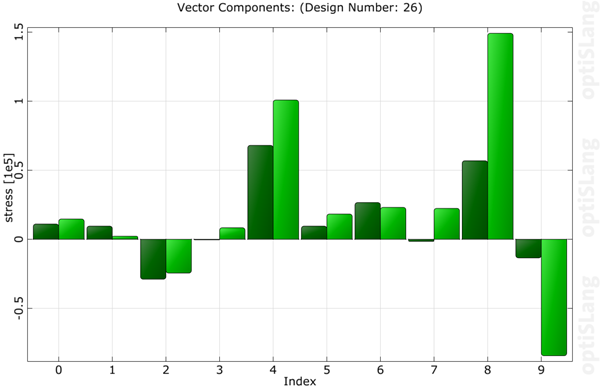
This bar chart plot shows the current design vector elements (response or criteria). If there is more than one vector available, the vector data can be selected in the Common settings pane. Each value bar is divided into two sub-bars in case approximated and validated designs are available. The left bar shows the validated element value and the right bar shows the approximated value. A big gap is an indication of a bad approximation. If you select a response vector element, its history is shown in the History plot.
Settings
| Option | Description |
|---|---|
| Common Settings | |
| Vector data | Switch between existing vector dimensions. |
| Preferences | |
|
The following preference settings are available:
For more details, see Plot Preference Settings. | |
Python scripting
Create Visual
Creates Vector Elements plot using data with data_id.
    vector_elements = Visuals.VectorElements(
        Id("Vector elements"),
        data_id
    )
Add to Postprocessing
Adds Vector Elements plot in postprocessing to control_container, using the specified relative positioning.
    control_container.add_control (
        vector_elements,
        True,
        RELATIVE_POSITIONING,
        0., 0., 1., 1./2.
    )