


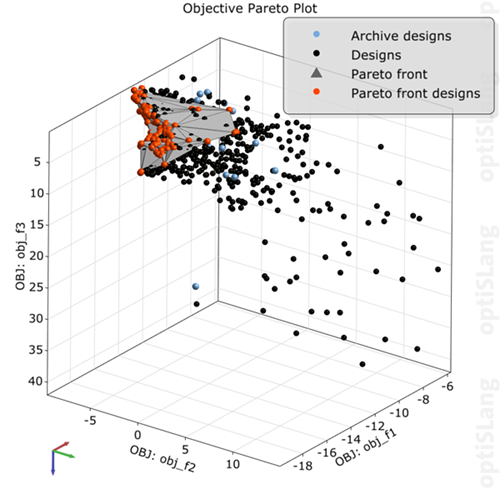
This plot shows the objective values of all designs for a pareto optimization in three dimensions. The pareto optimal designs aligned to a red pareto front show the approximated field of the optimal designs. If available, the archive designs of the selected generation are also shown and colored blue. If the selected design set is All designs or All archive designs, you can choose the shown archive. If validated designs are available, they are shown in green. You can select the current design for all bar chart plots.
Settings
| Option | Description |
|---|---|
| Common Settings | |
| Show | Switch between archives, visible if archives exist. |
| Preferences | |
|
The following preference settings are available:
For more details, see Plot Preference Settings. | |
Python Scripting
Create Visual
Creates Pareto 3D plot using data with data_id.
pareto = Visuals.Pareto3D(Id("Pareto 3D"), data_id)
Add to Postprocessing
Adds Pareto 3D plot in postprocessing to control_container, using the specified relative positioning.
    control_container.add_control (
        pareto,
        True,
        RELATIVE_POSITIONING,
        0., 0., 1., 1./2.
    )